Types of motion graphs
There are three main types of graphs used to define the motion of an object in a straight line: displacement-time graphs, velocity-time graphs, and acceleration-time graphs.
Displacement versus time graph
Figure 1 illustrates a displacement-time graph of an object moving at a constant velocity. For the displacement-time graph, displacement (denoted by d) is on the y-axis, and time (denoted by t) is on the x-axis.
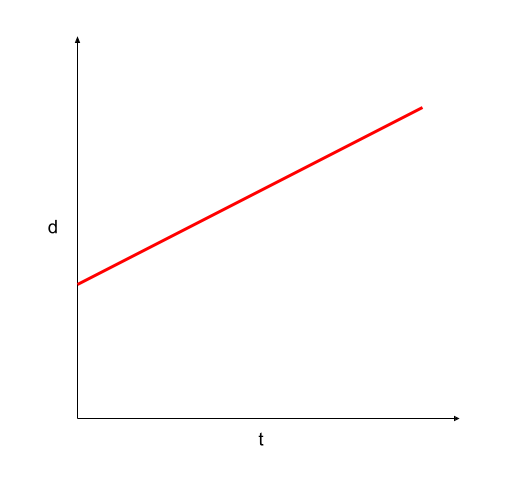
Figure 1. The displacement-time graph of an object moving at a constant velocity. Usama Adeel – StudySmarter Originals
From such a graph, we can obtain
- the distance covered at any given time,
- the average velocity by calculating the slope (gradient) of the graph, and
- the instantaneous velocity by calculating the derivative of any point on the curve.
To calculate the slope p of the above graph, we use the following equation:
\[p = \frac{y_2 - y_1}{x_2 - x_1} = \frac{\Delta d}{\Delta t} m/s\]
The rate of change of displacement is velocity, so the slope of the displacement-time graph is the velocity.
Velocity versus time graph
Have a look at the velocity-time graph below:

Figure 2. The velocity-time graph of an object moving at constant velocity. Usama Adeel – StudySmarter Originals
For the velocity-time graph, velocity (v) is on the y-axis, and time (t) is on the x-axis. From this graph, we can find
- the velocity at any given time,
- the average acceleration by calculating the slope of the straight line,
- the instantaneous acceleration by taking the derivative of any point on the curve, and
- the displacement of a body by calculating the area under the curve (between the line and the time axis).
To calculate the slope p of the above graph, we use the following equation:
\[p = \frac{y_2 - y_1}{x_2 - x_1} = \frac{\Delta v}{\Delta t} m/s^2\]
The rate of change of velocity is acceleration, so the slope of the velocity-time graph is the acceleration.
Furthermore, the area under the velocity-time graph gives the distance covered by the object, which is the displacement.
Acceleration versus time graph
For an acceleration-time graph, acceleration (a) is given on the y-axis and the time (t) on the x-axis. The acceleration-time graph gives us the acceleration at any given time. Also, the area under the acceleration-time curve represents a change in velocity.

Figure 3. The acceleration-time graph of an object moving at a uniformly increasing acceleration. Usama Adeel – StudySmarter Originals
Analyzing graphs of motion without numbers
Below we explore how to draw graphs of motion for different scenarios.
Graphs of Motion: An object at rest
For an object at rest, there will be no change in displacement, which will result in no change in velocity, and because there is no change in the velocity, the change in acceleration will be zero as well.
Displacement-time graph for an object at rest
An object at rest will not move. Hence, the displacement will not change over the interval of time which is depicted by a flat line parallel to the time axis.

Figure 4. The displacement-time graph of an object at rest. Usama Adeel – StudySmarter Originals
Velocity-time graph for an object at rest
The velocity will be zero because the object’s displacement doesn’t change. Hence, the graph for an object without its velocity changing over time can be shown with a straight line on the time axis.
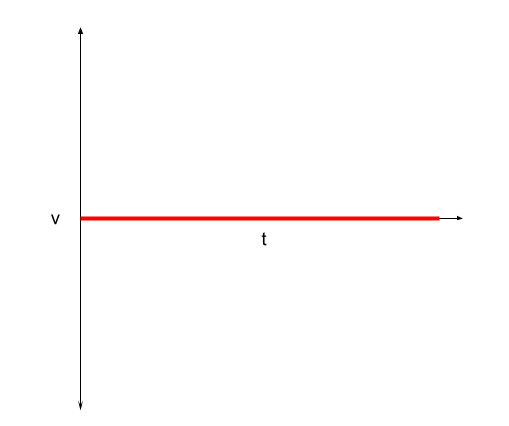
Figure 5. The velocity-time graph of an object at rest. Usama Adeel – StudySmarter Originals
Acceleration-time graph for an object at rest
The acceleration will be zero because the object’s velocity is not changing and the acceleration time graph be a flat line starting from the origin.

Figure 6. The acceleration-time graph of an object at rest. Usama Adeel – StudySmarter Originals
Graphs of Motion: Objects moving at a constant velocity (distance is increasing over time)
When an object moves at a constant velocity:
- The rate of change of displacement will be uniformly increasing.
- The velocity will be a continuous straight line with a positive or negative value depending on the direction of movement.
- Acceleration will be zero, so a constant line will pass through the origin.
Displacement-time graph for an object moving at a constant velocity
The slope of the below graph is positive, indicating the movement is in the positive direction (away from the origin). If this curve had been the same but with a negative gradient (towards the origin), it would have depicted displacement in the opposite direction. Also, displacement is uniformly increasing because the velocity is constant.

Figure 7. The displacement-time graph of an object moving at a constant speed from rest. Usama Adeel – StudySmarter Originals
Question: Which direction should be considered positive or negative?
Answer: The sign is arbitrary. You can take any direction as either positive or negative.
Velocity-time graph for an object moving at a constant velocity
As the slope of the displacement-time graph for a body moving with a constant velocity is positive in figure 7, the velocity is a constant straight line in the positive direction.

Figure 8. Velocity-time graph of an object moving at a constant speed. Usama Adeel – StudySmarter Originals
Acceleration-time graph for an object moving at a constant velocity
As there is no rate of change of velocity (constant velocity), the acceleration will be zero as well because for acceleration or deceleration to occur, there needs to be a change in velocity as well.

Figure 9. Acceleration-time graph of an object moving at a constant speed. Usama Adeel – StudySmarter Originals
Graphs of Motion: Objects moving with a constant acceleration (distance is increasing over time)
When an object moves with constant acceleration:
- The displacement-time graph will be a curve with a gradient that becomes increasingly steeper.
- The rate of change of velocity will be uniformly increasing.
- Acceleration will be constant with a positive value.
Displacement-time graph for an object moving with constant acceleration
Below are the two graphs for displacement vs time. Figure 10 is for constant acceleration and figure 11 is for constant deceleration.

Figure 10. Displacement-time graph of an object moving at constant acceleration. Usama Adeel – StudySmarter Originals
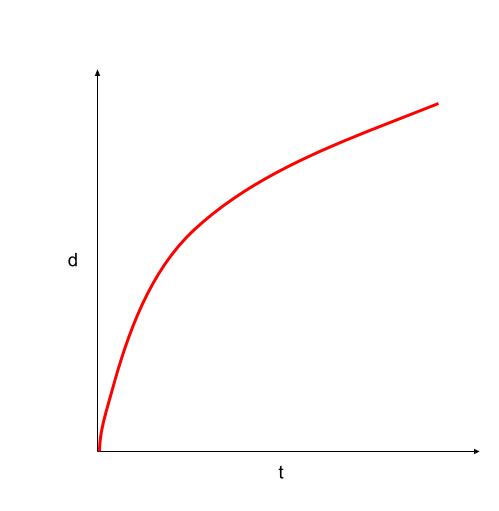
Figure 11. Displacement-time graph of an object moving at constant deceleration. Usama Adeel – StudySmarter Originals
If you take the tangents at various points on both of the above curves, you will see that the slope of the displacement-time graph in figure 10 is becoming steeper and steeper. This is an indication that the velocity is increasing. In figure 11, the gradient is gradually decreasing, which is an indication that the velocity is decreasing.

Figure 12. Displacement-time graph of an object moving at constant acceleration. The slope is getting steeper, indicating constant acceleration. Usama Adeel – StudySmarter Originals
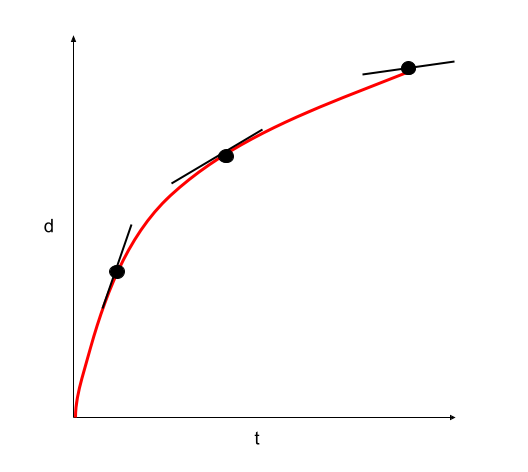
Figure 13. Displacement-time graph of an object moving at constant acceleration. The slope is getting flatter, indicating constant deceleration. Usama Adeel – StudySmarter Originals
Velocity-time graph for an object moving with constant acceleration
The velocity-time graph for a constant acceleration will be a uniformly increasing line as shown by the figure below.
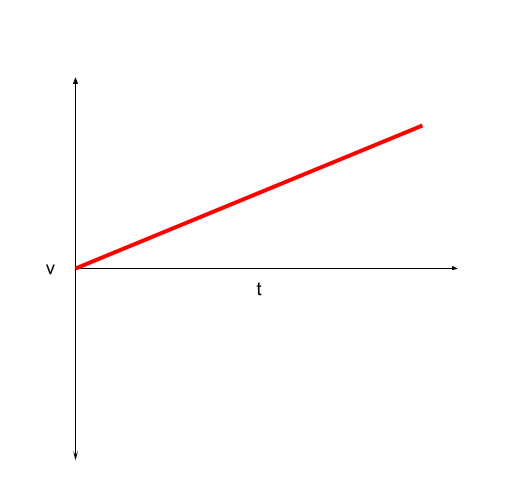
Figure 14. Velocity-time graph of an object moving at constant acceleration. Usama Adeel – StudySmarter Originals
Acceleration-time graph for an object moving with constant acceleration
As the acceleration is not changing over time and is constant, the acceleration-time graph can be represented by a straight line.

Figure 15. Acceleration-time graph of an object moving at constant acceleration. Usame Adeel – StudySmarter Originals
Graphs of Motion: An object moving at a constant deceleration (distance is increasing over time)
When an object moves with a constant deceleration:
- The displacement-time graph will be a curve with a gradient that becomes more and more horizontal.
- The rate of change of velocity will uniformly decrease.
- Acceleration will be constant but with a negative value.
Displacement-time graph for an object moving with constant deceleration
Because the body is decelerating, the curve is approaching a constant (unchanged) value.

Figure 16. Displacement-time graph of an object moving at constant deceleration. StudySmarter Originals – Usama Adeel
Velocity-time graph for an object moving with constant deceleration
The velocity-time graph for a constant deceleration will be a uniform line constantly decreasing from some value.

Figure 17. Velocity-time graph of an object moving at constant deceleration. Usama Adeel – StudySmarter Originals
Acceleration-time graph for an object moving with constant deceleration
The constant line with a negative acceleration shows that an object is decelerating with a constant value.

Figure 18. Acceleration-time graph of an object moving at constant deceleration. Usama Adeel – StudySmarter Originals
Graphs of Motion: Throwing an object straight up with the object returning to the thrower
For this scenario, an object, let’s say a ball, is thrown upwards in such a way that it lands in the thrower’s hand after some time. Air resistance is negligible, and the only forces acting on the ball come from the thrower (to throw the ball upwards) and the gravitational pull on the ball until it lands in the thrower’s hand. The upwards direction is considered as positive.
Displacement-time graph for an object thrown straight up
The displacement-time graph for an object thrown straight up and then landing in the thrower's hand is shown below.
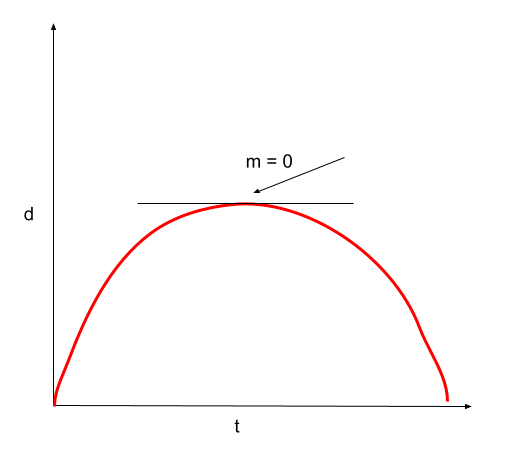
Figure 19. Displacement-time graph of an object thrown in the air and caught at the same height. Usama Adeel – StudySmarter Originals
Once the ball is thrown in the air, the ball’s displacement increases because we have taken the upwards direction as positive. As it reaches the top, the gradient of the displacement-time graph will be zero for a brief moment, indicating that the ball is changing its direction and will move downwards from here on. Therefore, the graph will move downwards until the ball reaches its original position.
But why is the graph a curve and not a straight line? The acceleration due to gravity is constant, with a value of 9.81m/s2. So, from the moment the ball is thrown until it is caught, the deceleration due to gravity and the acceleration due to free-fall will be constant and different from zero.
Velocity-time graph for an object thrown straight up
The velocity-time graph for an object thrown straight up and then landing in the thrower's hand is shown below.

Figure 20. Velocity-time graph of an object thrown in the air and caught at the same height. Usama Adeel – StudySmarter Originals
The ball is thrown upwards with some initial velocity u. As the ball reaches the top, its velocity decreases uniformly until it reaches zero, where the ball is at rest for a brief moment. Afterwards, the ball moves downwards with a uniformly increasing velocity.
As the distance travelled will be the same upwards and downwards because of negligible air resistance, the initial velocity will be equal to the final velocity -u. So, the area of both regions A and B will be the same in this case.
Why is the slope of the graph negative and not positive after u reaches zero? As the upwards direction is taken as positive, once the direction of the ball changes at the top, the motion will be downwards in the negative direction with a constant acceleration of free fall.
Acceleration-time graph for an object thrown straight up
The acceleration-time graph for an object thrown straight up and then landing in the thrower's hand is shown below.
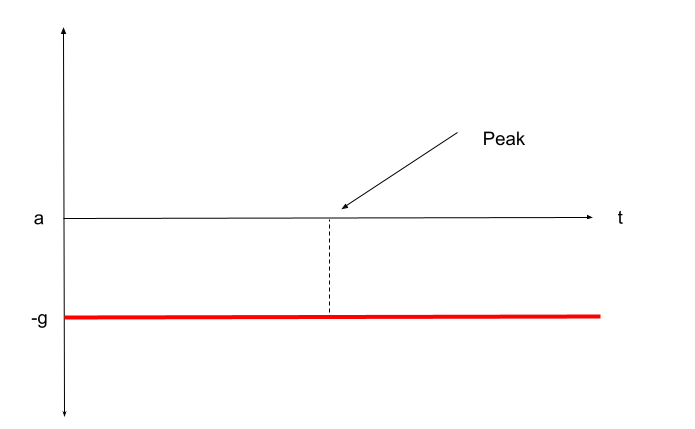
Figure 21. Acceleration-time graph of an object thrown in the air and caught at the same height. Usama Adeel – StudySmarter Originals
The acceleration is a constant -9.81m/s2 throughout the displacement as the velocity-time graph is uniformly decreasing.
After the ball is tossed in the air, the gravitational force works in the direction opposite to the upwards motion. Since the upwards motion is taken to be positive, the gravitational force will be negative. Once the ball reaches its peak, the ball changes direction. Hence, the gravitational force will continue to be negative.
Graphs of Motion - Key takeaways
Similar topics in Physics
Related topics to Mechanics and Materials


