Regression
Regression is the numerical relation between two variables (we now need an independent and dependent variable). We normally look at a linear regression; if our two variables are X and Y, we seek a relationship of the form Y = mX + c. This means that this will look like a straight line on a scatter graph. We often refer to a regression line as a line of best fit.
Correlation does not mean causation!
It is important to remember that just because correlation exists, it does not mean there is necessarily causation. For example, we could find a correlation between the number of firefighters sent to a fire and the amount of damage created by that fire. As we can gather, the number of firefighters sent does not result in more damage occurring, so we have a case with an apparent correlation but no causation. This means when we look at supposed correlations, we should judge whether this correlation has causation.
Classification of correlation
When we describe correlation, we use two measures: strength and parity.
Strength
We can describe the strength of a correlation between two variables.
If there is a strong correlation, we have a strong relationship between the two variables (i.e. there is a strong indication that there is a dependency between variables). If we were to draw a regression line (line of best fit), all the data points would be very close to the line.
If there is a weak correlation, there is a weaker relationship between the two variables (this means there is less indication that there is a dependency between variables). If there were a regression line, the points would be more spread away from the line.
Parity
Parity is a special way of saying whether the correlation is positive or negative. If there is a positive correlation, this means that as one variable increases, the other variable increases. On a regression line, this means that the gradient is positive. If the correlation is negative, then as one variable increases, the other variable decreases. On a regression line, this means that the gradient is negative.
If the correlation is weak enough (to the extent that there is no real correlation), then we call this a zero correlation. This would mean we couldn't draw a regression line.
We often use a correlation coefficient to describe correlation, this varies from -1 to 1. The strongest positive correlation is represented by 1, the strongest negative correlation is represented by -1, and a zero correlation by zero. It is a sliding scale between these values.
Below are examples of different correlations:
Zero correlation:
 Zero correlation scatter graph, Tom Maloy, StudySmarter Originals
An example of something with no correlation would be the shoe size of children in the UK and the number of sunflowers in France. These are unrelated and thus neither influence one another, and so, no correlation.
A strong positive correlation:
 Strong positive correlation scatter graph, Tom Maloy, StudySmarter Originals
An example of a strong positive correlation would be hours spent in direct sunlight and the severity of sunburn. As one of these variables increases, then so does the other.
A strong negative correlation:
 Strong negative correlation scatter graph, Tom Maloy, Study Smart Originals
An example of a strong negative correlation would be the speed of a train versus the time to complete a journey from one station to the next. As speed increases, time to destination decreases. As this is a physical relation, this will be strongly related.
A weak positive correlation:
 Weak positive correlation scatter graph, Tom Maloy, StudySmarter Originals
An example of a weak positive correlation may be the prescription of a particular drug and increased kidney failure. The drug is unlikely to cause everyone to have kidney failure, but it will increase the likelihood for some people.
A weak negative correlation:
 Weak negative correlation scatter graph, Tom Maloy, StudySmarter Originals
An example of a weak negative correlation would be lessons missed and end grades. In general, the number of lessons missed would decrease grades; however, this will differ from student to student to end up with a weaker relationship.
A real-life example of correlation and regression
There are many real-life examples of correlation and regression. In the COVID-19 pandemic, many governments will have tracked COVID deaths/hospitalisations/case numbers against various metrics, such as age, weight or location, to try and find a pattern and see where help would be needed most. There would first be a look at correlation to see if there were any apparent patterns, and then they would use regression to try and predict any missing data values.
Example question involving correlation and regression
Q: Below is a table showing the data for students in a class, where height and arm length was measured.
Height (cm) | 127 | 135 | 142 | 151 | 158 | 161 | 163 | 170 | 176 |
Arm Length (cm) | 70 | 75 | 82 | 89 | 91 | 95 | 88 | 98 | 103 |
Draw a scatter graph to represent the data
Describe the correlation between the data sets
Use a regression line to predict the arm length of person who is 165cm tall.
A:
Let us plot this with height on the x-axis and arm length on the y-axis. This looks like
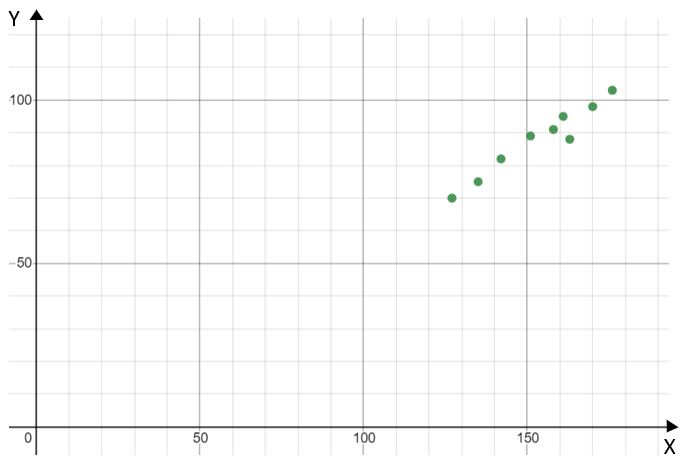
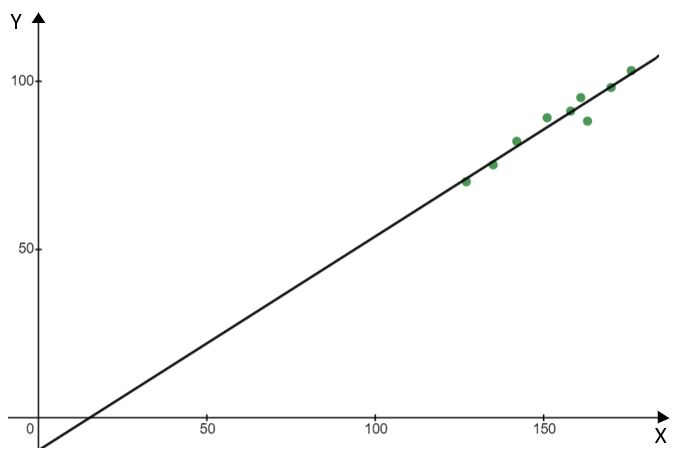
Looking at the scatter graph, as height increases, so does arm length, meaning there is a positive correlation. If we were to draw a regression line on the graph, the points would be close to this line, meaning there is a strong positive correlation between arm length and height.
Our first step here is to draw on our regression line. This should look something like this:
From this point, we draw a line of x = 165 and then see where this intersects with the regression line. Then the y value of this intersection point will be our estimate for arm length.
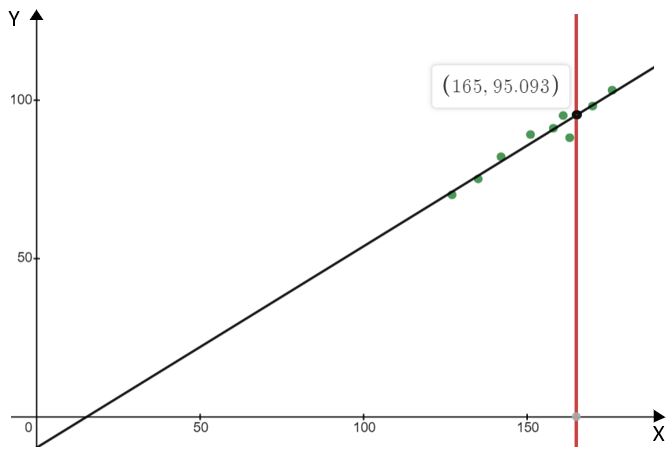
This means our estimate for arm length is 95cm.
Correlation - key takeaways
A strong correlation means that the variables appear to depend on one another.
A weak correlation means there is less evidence to suggest there is a dependency on one another.
A positive correlation looks to have a positive gradient.
A negative correlation looks to have a negative gradient.


