Why do we use standard normal distribution?
Standard normal Distributions are useful because their mean is 0 and their Standard Deviation is 1. It is therefore easy to calculate unknowns and the probabilities of certain values occurring or to effectively compare data sets to each other based on means and default deviation.
The equation of a standard normal distribution Probability density function (pdf) is
\[ \phi(z)=\frac{1}{\sqrt{2\pi}} \exp\left\{-\frac{z^2}{2} \right\}. \]
Standard
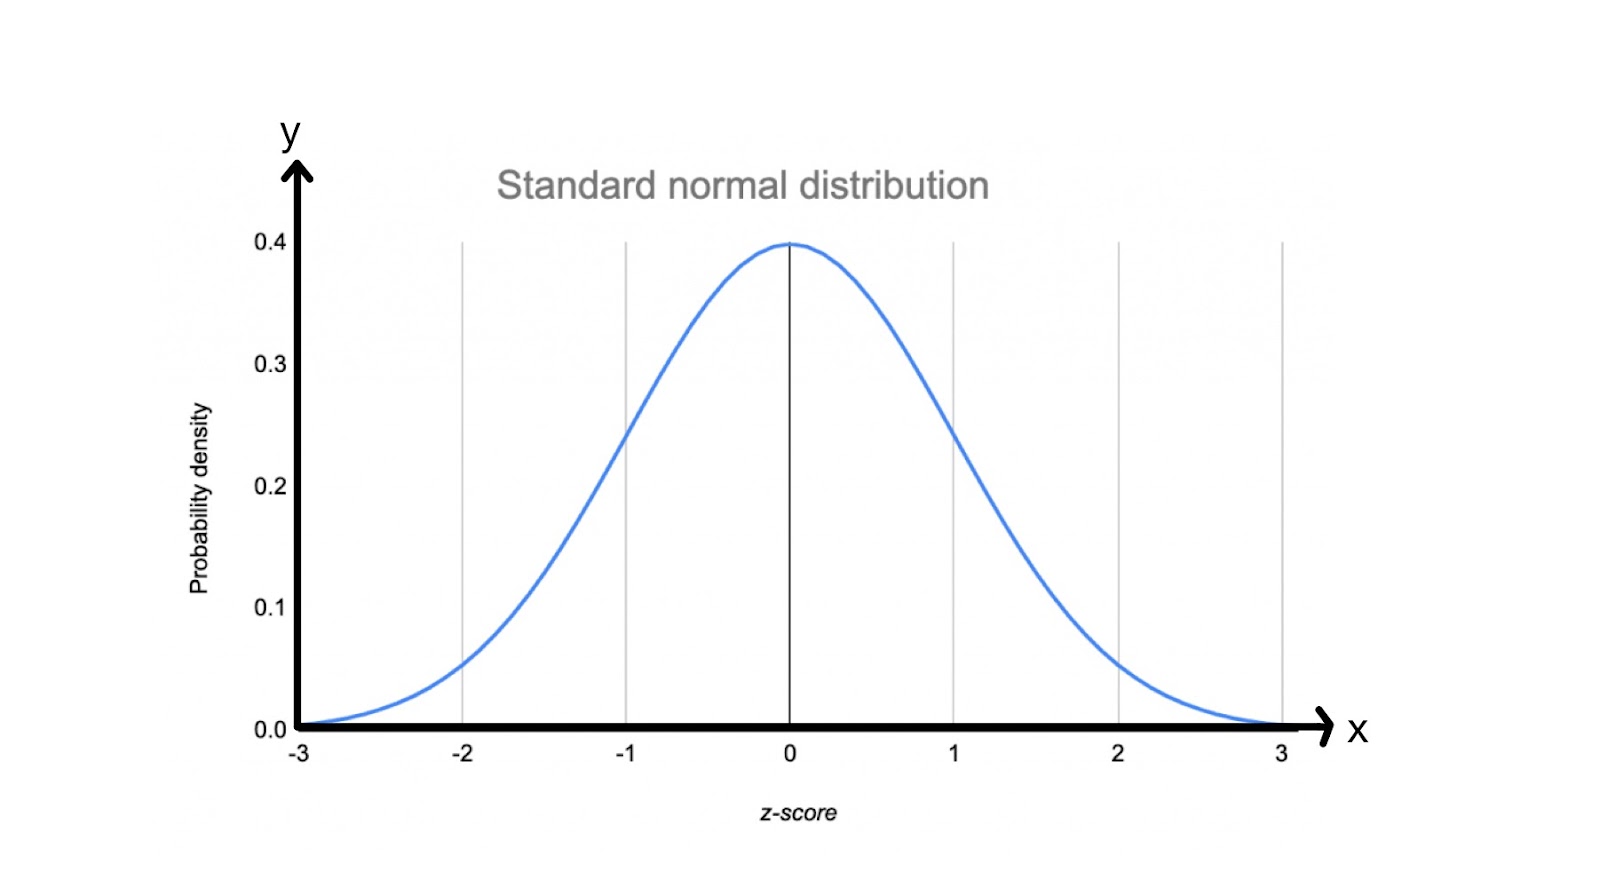
normal distribution
The graph has a vertical axis of symmetry \( x=0 \), and both a variance and a Standard Deviation of 1 when \( z=-1 \) and for \( z=1\), in other words, when the raw x-score is more than 3 standard deviations from the mean, \( \phi(z) \sim 0 \).
A z-value, z-score, or standard score (used interchangeably) describes the position of a specific score in terms of its distance from the mean, and is measured in Units of standard deviation. Z-scores are positive when the value lies above the mean, and negative if it lies below.
What is the formula for standard normal distribution?
A normal distribution has the formula .
A standard normal distribution has the formula .
We can convert a normal variable X to a standard normal variable Z. If , the equation , can be used, which converts an X-score to a Z-score. This formula is derived from a change of variable technique of a Probability density function modeling a normal distribution.
The Notation is equivalent to the Notation and can be interchanged when referring to a standard normal distribution.
A variable is randomly distributed . Write in terms of for some value of z.
Since the normal distribution is continuous, .
We know that the probabilities in a normal distribution add up to 1, therefore . We then convert this distribution to a standard normal distribution.
We substitute known values into the formula .
Therefore,
Hence,
Finally,
This is in terms of , therefore it answers the question.
You may also be asked to find the probability that a variable is in a given interval.
Given that , find correct to 3 significant figures.
First, let's sketch a graph:
 Graph of normal distribution with shaded areas
Next, we will convert the x-scores to z-scores.
When
When
The area to the right of z=0 is:
The area to the left of z=0 is:
We then add the 2 areas together
, to 3 significant figures
The example below illustrates how the standard normal distribution can be used to compare real-life data sets.
A student scores 73% on her English exam, where the class mean was 68% and the standard deviation was 10.2%. In Biology, she scored 66%, where the class mean was 62% and the standard deviation was 6.8%.
In which subject did she perform better compared with the rest of her class?
Assume that scores for both subjects were normally distributed.
To be able to effectively compare the student's scores, they need to be standardised.
English z-score:
Biology z-score:
Interpretation – the student's z-score determines the Number of standard deviations between her score and the class mean, in both cases, above the mean.
The larger the z-score, the further above her score is from the mean, and the better she performed compared to the rest of her class.
The student performed best in Biology.
Finding the mean of a standard normal distribution
The standard normal distribution can be used to solve for an unknown mean, standard deviation value, or variance of a normal distribution. The mean of a standard normal distribution is 0, so when the x-score is converted to a z-score, unknowns become easier to calculate. A graphical calculator with an inverse normal function is often required in these questions. Questions can either ask to find one unknown from one probability or two unknowns from two probabilities. Let us look at examples for both.
The weights of handmade necklaces in a store are known to be normally distributed with a standard deviation of 5.9g. If 15% of necklaces weigh less than 58.2g, find the mean weight of the necklaces.
Let the mean weight of the necklaces be µ. The information given can therefore be written as
Additionally,
We now convert this x-score to a z-score.
We now use the inverse normal function on the calculator, for N(0, 1²) and probability=0.15
Then, solve for µ.
The mean weight of the necklaces is approximately 64.3g.
In this example, both parameters are missing.
The random variable . Given that , and , find the value of µ and σ.
To solve this question, it is necessary to convert the x-scores to z-scores and then solve the two Equations simultaneously.
Using the inverse normal function for both probabilities, we obtain:
other
We then solve these two Equations simultaneously. This can be done by hand or using the simultaneous equation solver on the calculator.
We obtain: and , to 3 significant figures.
Using the standard normal distribution table
When z is normally distributed with mean 0 and standard deviation 1 (standard normal distribution), there is a table that can be used instead of a calculator. It gives the value for where . For negative values of z, you use . You can find this table in statistical booklets and textbooks.
Standard Normal Distribution - Key takeaways
- A standard normal distribution is denoted as having a mean of 0 and a standard deviation of 1.
- If , this normal distribution can be standardised by converting x-scores into z-scores using:.
- The notation is equivalent to
- The area under the graph is 1.
- Standard normal Distributions can be used to calculate unknown values (mean or standard deviation). Two probabilities are needed if both values are unknown.
- Two data sets with different means and standard deviations can be directly compared when standardised.
(explanation) en-statistics-distributions-probability distribution-standard normal distribution-why standard normal distribution


