When collecting data for research, there are four different types of data in statistics that you can collect: quantitative, qualitive, continuous and discrete data. Not all of these are mutually exclusive! This article will cover how to spot which types of data you'll need to use and what this means for your analysis.
Quantitative data
Quantitative data are associated with numbers (or quantitative variables). This type of data helps you answer the 'how much' or 'how many' questions.
Your height and age are considered quantitative data as they are numbers. Some questions that you often answer with this type of data would be:
- How much was that coffee?
- How many pairs of shoes do you have?
- How much does a bus weigh?
Although the examples above are all pieces of quantitative data, they all describe very different things and have different units. This is why you should always specify any units when answering statistics problems (or any maths problems)!
- How much did that coffee cost?
- The cost of something, if you're in the UK, will have a unit of Pounds Sterling, £
- How many pairs of shoes do you have?
- The answer to this question is a count or frequency
- How much does a bus weigh?
- A likely unit for this particular measurement of weight could be tonnes
Quantitative data are also particularly useful since it is easy to visualise using graphs like line graphs, pie charts or scatter graphs.
The following is data about the number of students in year groups at a school.
| Year group | Year 7 | Year 8 | Year 9 |
| Number of students | 167 | 175 | 214 |
This information can be represented using a pie chart by dividing the number of students in each group by the total number of students:
 Pie chart example
This could also be demonstrated using a bar chart:
 Bar chart example
Qualitative data
Qualitative data are descriptive and can be used to describe things like characteristics such as colour or opinion. This type of data often helps you find answers to more descriptive interview based questions.
Your hair colour or fashion sense can be considered qualitative as they are descriptive. Some questions that can be answered with this type of data are:
- What is your favourite ice cream flavour?
- What colour is your car?
- What do you like to do at the weekend?
In order to represent qualitative data, you often use the frequency to find meaningful statistics. For example, if you're collecting information from a survey, you would count the number of particular responses. You would be effectively turning qualitative data into quantitative data which can be analysed much more easily.
Continuous variables
A continuous variable is a variable that can take any integer or non-integer value within a given range.
The temperature of something can be considered a continuous variable, since it does not have to take a single integer or non-integer; the temperature on a summer's day could be 25.6°.
Discrete variables
A discrete variable is a variable that can only take a specific non-decimal value, for example, the number of people that take math classes.
The number of people in year 8 or the number of people at the football stadium would be considered as examples of discrete variables since the answers cannot take an infinite number of decimal values. The number of people in year 8 can be 72, it can not be 72.3.
Let's take another example.
Are the following examples continuous or discrete variables? Explain why.
a) Shoe size
b) Height in inches
c) Average number of puppies in a litter
Solution
a) Although you can have shoe sizes like 4.5 as well as integer numbers, these are still discrete since you cannot have a shoe size of 4.563!
b) This measurement, if takes accurately, can be to many decimal places.
c) Whilst the number of puppies in a litter is a discrete value since it is a count, the average number is actually continuous!
For example, if you were to have 5 litters each containing 3, 6, 7, and 5 puppies in each litter, you would have \(\frac{3+6+7+5}{4}=21/4=5.25\). Averages are always continuous variables since they could take on any number of decimal points.
Are there any other kinds of data?
The following are more types of data that you may be interested in, but you won't need to know these for your exam.
Nominal data
Nominal data is qualitative data without any quantitative value or order. For example, colours are nominal since they do not have an inherent order.
Ordinal
Ordinal data is qualitative, but has an order. For example, the responses to a questionnaire: "very likely", "likely", "unlikely"... can be ordered.
Interval data
Interval data is quantitative data that has a scale with no zero value. Temperature in degrees is an example of interval data. Temperature does have 'absolute zero', but this is an arbitrary assignment rather than an amount.
Ratio data
Ratio data is quantitative data that has a scale but, unlike interval data, contains zero. Length is an example of ratio data since it is possible for something to have no length.
How do we display data?
We have collected the required data, but how do we display these data?
If a large amount of data has been collected, then it can be displayed as a frequency table or as grouped data. When data is displayed on a grouped frequency table, specific values are not shown. Instead, they are grouped into what is known as classes. An example of a grouped frequency table is shown below.
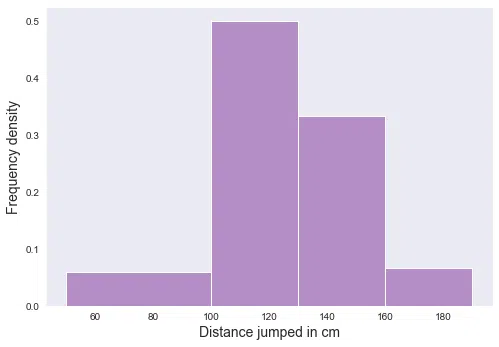
This is a table that shows how far a group of students could jump in their PE lesson.
| Distance jumped (cm) | Number of students | Class width | Midpoint |
| 50-100 | 3 | 50 | 75 |
| 101-130 | 15 | 29 | 115.5 |
| 131-160 | 10 | 29 | 145.5 |
| 161-190 | 2 | 29 | 175.5 |
The column on the left shows the class boundaries. This is the minimum and maximum values that are in that class. The second column shows the number of students that fall into that class.
The term class width refers to the difference between the two class boundaries. The midpoint of the class tells you the central value in this class, and is found by adding half of the class width to the minimum value in that class.
The above data can be displayed in a number of ways. Let's take a look at something called a histogram.
A histogram plots the classes on the x-axis and frequency density on the right axis. Frequency density is the frequency divided by the width of the class.
We can write this in a column on the end of the above table.
| Distance jumped (cm) | Number of students | Class width | Midpoint | Frequency density |
| 50-100 | 3 | 50 | 75 | 3/50 |
| 101-130 | 15 | 29 | 115.5 | 15/29 |
| 131-160 | 10 | 29 | 145.5 | 10/29 |
| 161-190 | 2 | 29 | 175.5 | 2/29 |
This can be plotted as shown below.
Types of Data in Statistics - Key takeaways


