In a Probability setting, the set of everything we are considering in a Venn diagram is called the sample space, and we denote the sample space by 𝛏 (the lowercase Greek letter xi). An example of a set would be students in a school or people going to the gym. More generally, we take a set to be a group of data points in Statistics.
We often only need to consider two types of Venn diagrams; those with two subsets and those with three.
How do you draw a Venn diagram?
To draw a Venn diagram, we can follow a series of logical steps. We will first look at drawing a diagram for two subsets of the sample space. For now, we will call these A and B.
Step 1: Draw two circles, which have an overlapping section in the middle.
Step 2: Draw a rectangle around the outside of these two circles, leaving room between the circles and the rectangle.
Step 3: Label the rectangle with 𝛏, do this on the outside. This rectangle represents our whole sample space.
Step 4: Label one circle A, and the other B, as these represent our two subsets.
The result should look like this:
 Example Venn diagram with two subsets of the sample space, Tom Maloy - StudySmarter Originals
For three subsets of the sample space, say A, B, and C, we follow similar steps but with three circles overlapping, as seen below.
 Example Venn diagram with three subsets of the sample space, Tom Maloy - StudySmarter Originals
Examples of Venn diagrams
To get a grasp on how Venn diagrams work, let’s have a look at the following Venn diagram examples.
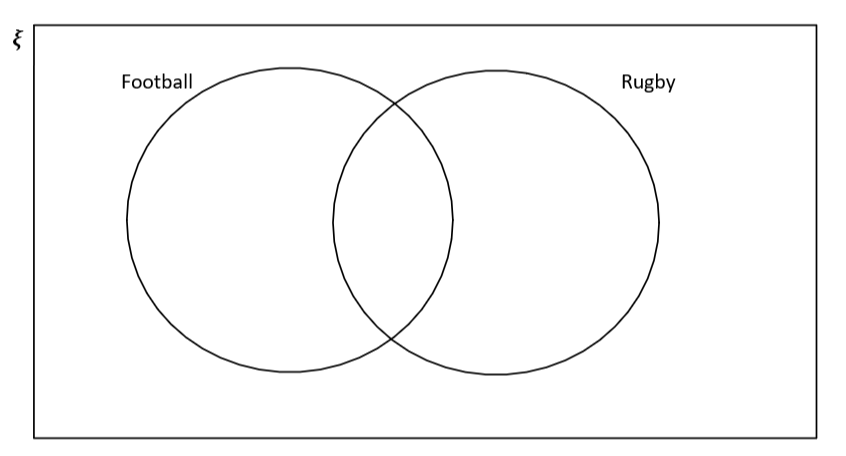
Suppose we have a class of 40 students, 22 play football, 16 play rugby and 8 play both. Let us first draw the Venn diagram without filling in any values. This gives us:
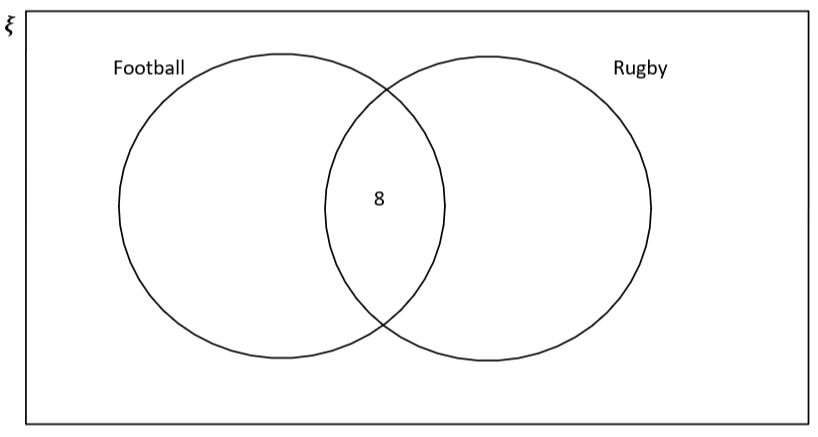
The first bit of information we can fill in is that we can put 8 in the intersecting section of the circles, as 8 students play both rugby and football. This gives us:
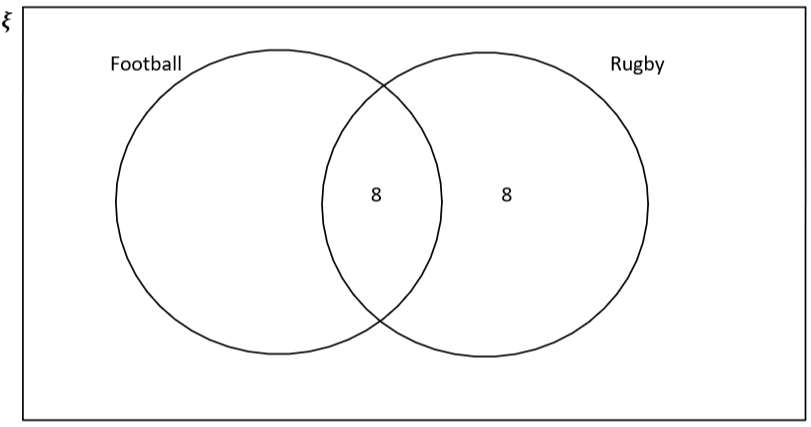
A total of 16 people play rugby, which includes the 8 who play both. That means in the section which is just rugby, we should put 16-8=8.
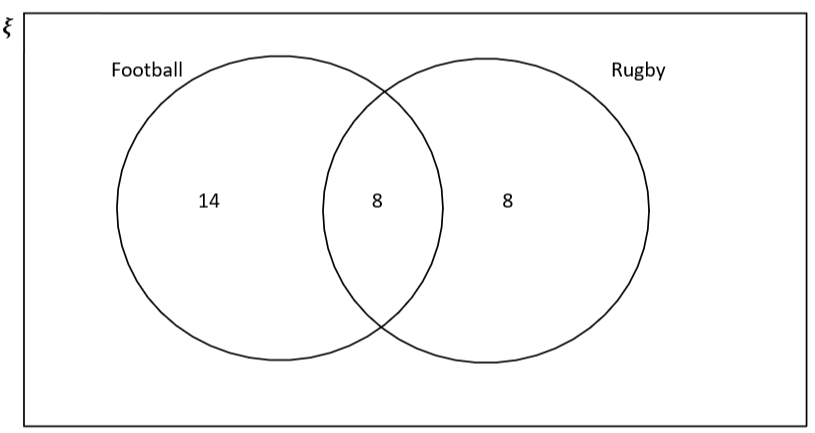
A total of 22 people play football, and that includes the 8 who play both, meaning we have 22-8=14 in the section which represents football.
We have 40 students in the class. This is our sample space, meaning all our numbers must sum to 40. 14+8+8=30, meaning 10 people don’t play either sport and must be placed in the rectangle, but not in either circle.
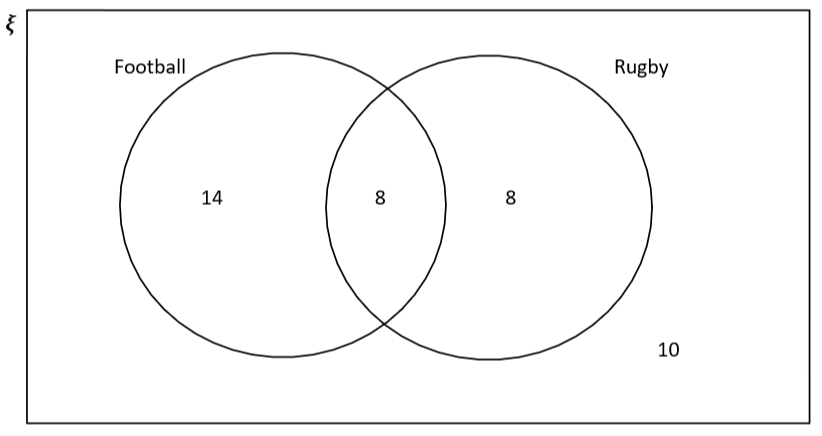
This is now our completed Venn diagram for the situation we described.
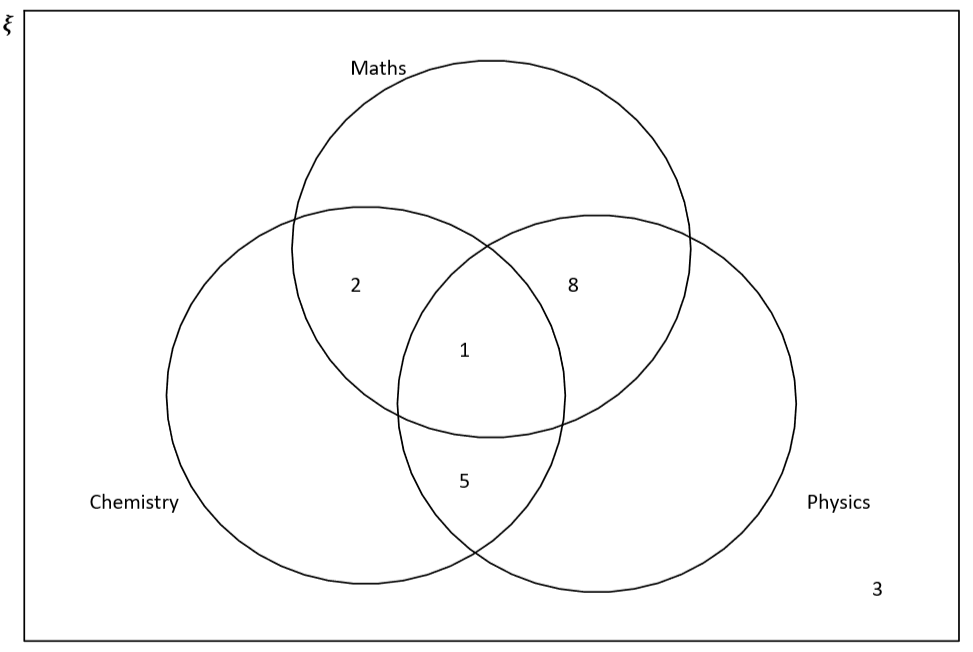
I interviewed some university students. 25 do maths, 20 do physics, and 19 do chemistry. 1 student does all three, and 3 do none of the above. 2 students do maths, chemistry and not physics, 5 students do physics and chemistry without maths, and 8 students do maths and physics without chemistry. Draw a Venn diagram to display this data.
First things first, let us draw the outline of the diagram, and fill in the information given to us. This comes out as:
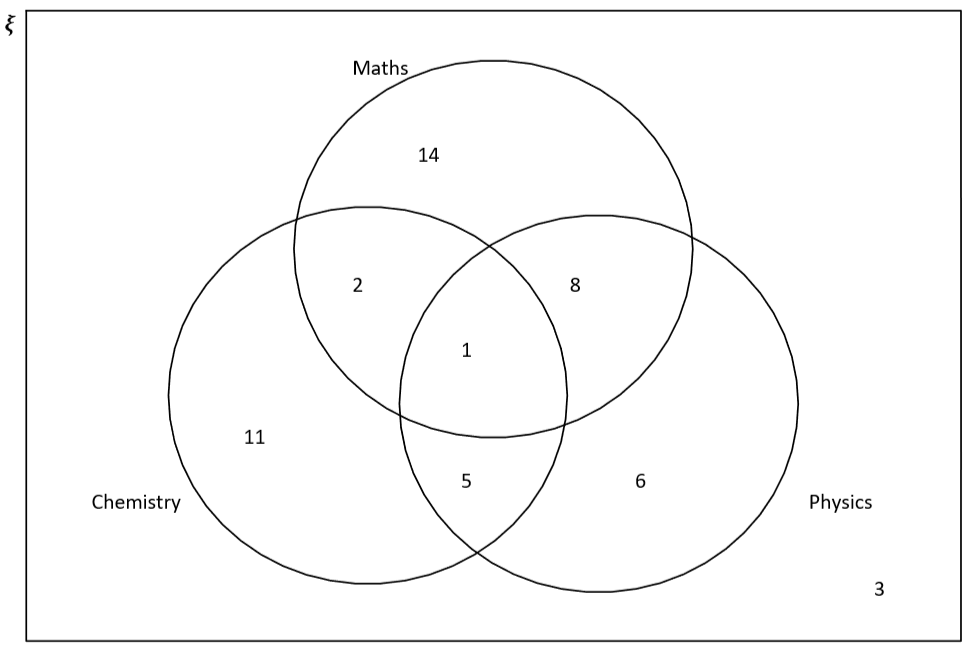
We now need to sum the numbers to find the missing values. 25 do maths, so the Number of people who do just maths is given by 25-2-1-8, which gives 14. We do the same for physics and chemistry, so the number of students who do just physics is given by 20 -8-1-5=6. The students doing just chemistry is given by 19-2-1-5=11. This means we can fill in the Venn diagram as follows:
Logic operators on sets
When we have multiple sets acting together, we can describe parts of them using logic operators. All of these symbols are common whenever we discuss Venn diagram Notation.
Union of sets
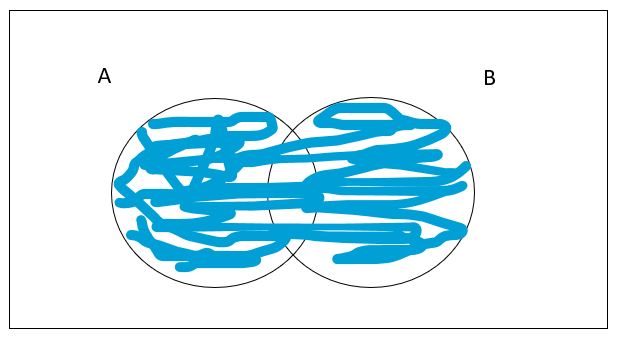
The union of sets, denoted by ∪, is a logic operator we can use on sets. When we see this operator, we should think of replacing it with ‘or’. For example, if I denoted A=people who like rugby and B= people who like cricket, and I wrote the statement A∪B, we would interpret this as ‘the people who like cricket or the people who like rugby or the people who like both’. On a Venn diagram, if I were to shade A∪B, it would look like this:
 Union of 2 sets, Tom Maloy, Study Smarter Originals
So for an object to be in A∪B, it needs to be in either set.
Intersection of sets
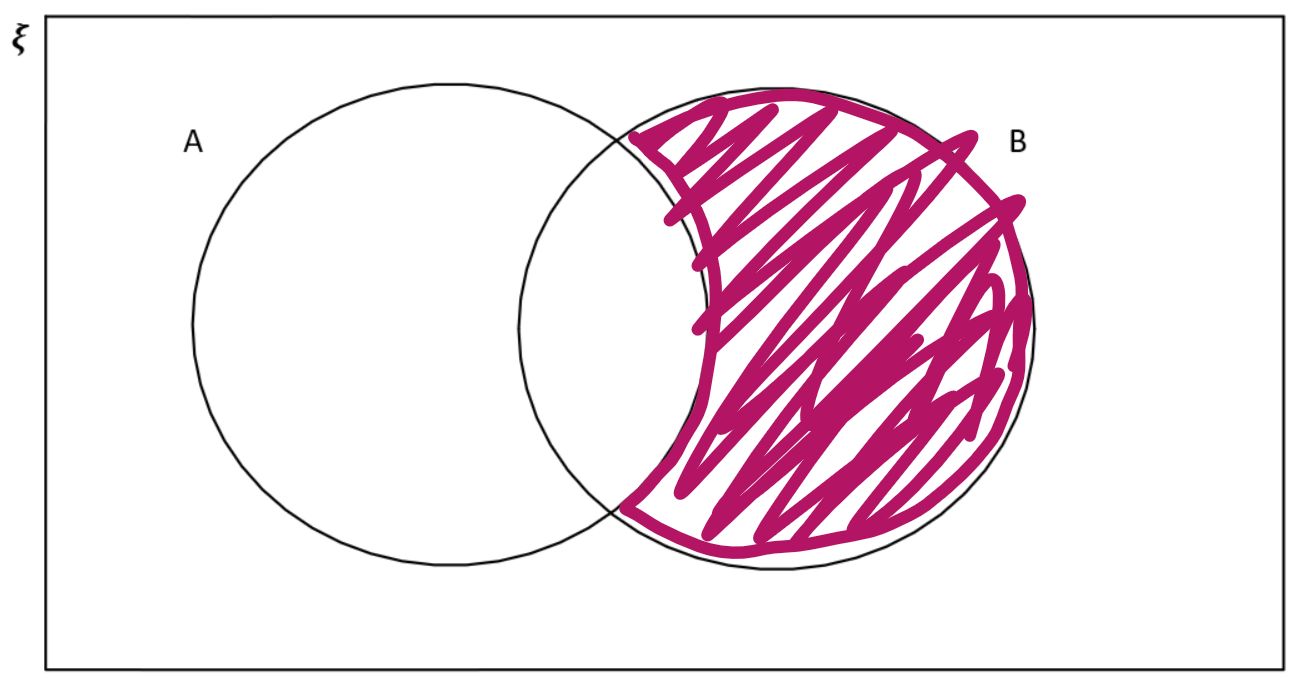
The intersection of sets is a different logic operator we use on sets and is denoted by ∩. When we see this operator, we should think of replacing it with ‘and’. With A and B denoted as above, if we saw A∩B, we should interpret this as ‘People who like cricket and rugby’. On a Venn diagram, it would look like this:
 Intersection of 2 sets, Tom Maloy, Study Smarter Original
So for an object to be in A∩B, it needs to be in both sets.
Complement of sets
The final logic operator we need to know about is the complement, which we should think of as ‘not’. If I wanted to write the complement of A, I could write either A’ or .
Again with A as above, we would interpret as ‘the set of people who don’t like rugby’. On a Venn diagram, this would look like this:
 Complement of a set, Tom Maloy, Study Smarter Originals
How is probability represented using Venn diagrams?
As we mentioned earlier, Venn diagrams can help us determine probabilities. For example, if we look at example 2 from above, we could ask a question such as ‘find the Probability of a student only studying one of maths, physics or chemistry.’ In this case, we would use the general probability equation:, which gives us .
Two events are mutually exclusive if they cannot happen at the same time. In a Venn diagram, this would mean the intersection is empty, and if A and B are mutually exclusive, P(AB)=0.
Let the sample space be the Integers from 1 to 10. Draw a Venn diagram with Prime Numbers and even numbers as our two sets. Find the probability of choosing a Number that is even but not a prime.
Let us first write all the numbers which are prime between 1 and 10 and do the same for even numbers.
Primes: 2,3,5,7
Even: 2,4,6,8,10
This means we only have 2 in the intersection, giving a Venn diagram of
Then P(choosing a number which is even but not prime)=number of numbers which are even but not prime total numbers=
Logic relations on a Venn diagram
We can also be asked to shade a Venn diagram based on a logic relation, and we have a method to do this, as shown below.
Suppose we had a logic relation between two sets, say A and B. (e.g. A’∪B or A∩B’)
Step 1: Shade the logic relation on A in one colour.
Step 2: Shade the logic relation on B in a different colour.
Step 3: If the two events (A and B) are related by a union, our diagram showing the relation would be wherever there is any shading. If it is an intersection, it would be where there is shading of both.
Shade the relation A’∩B
Step 1: Shade A’:
Step 2: Shade B in a different colour
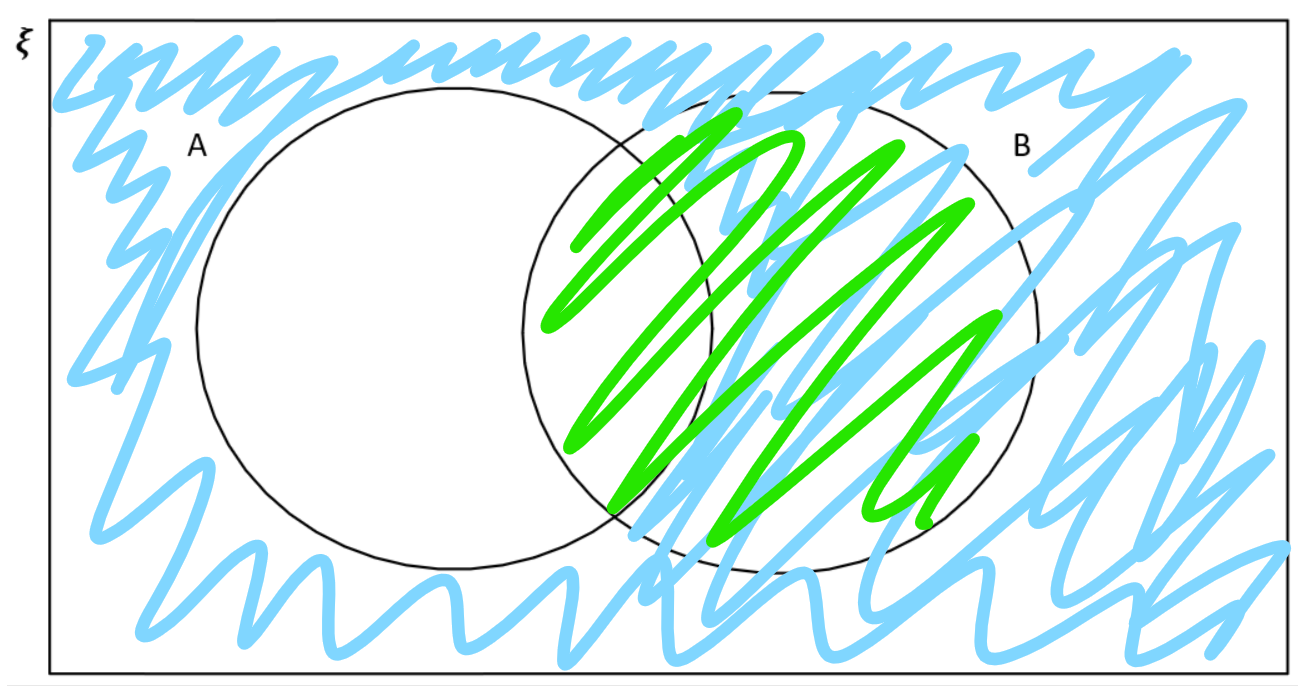
Step 3: As this is at an intersection, we now know that A’∩B is represented by the regions where there are both colours, as shown below.
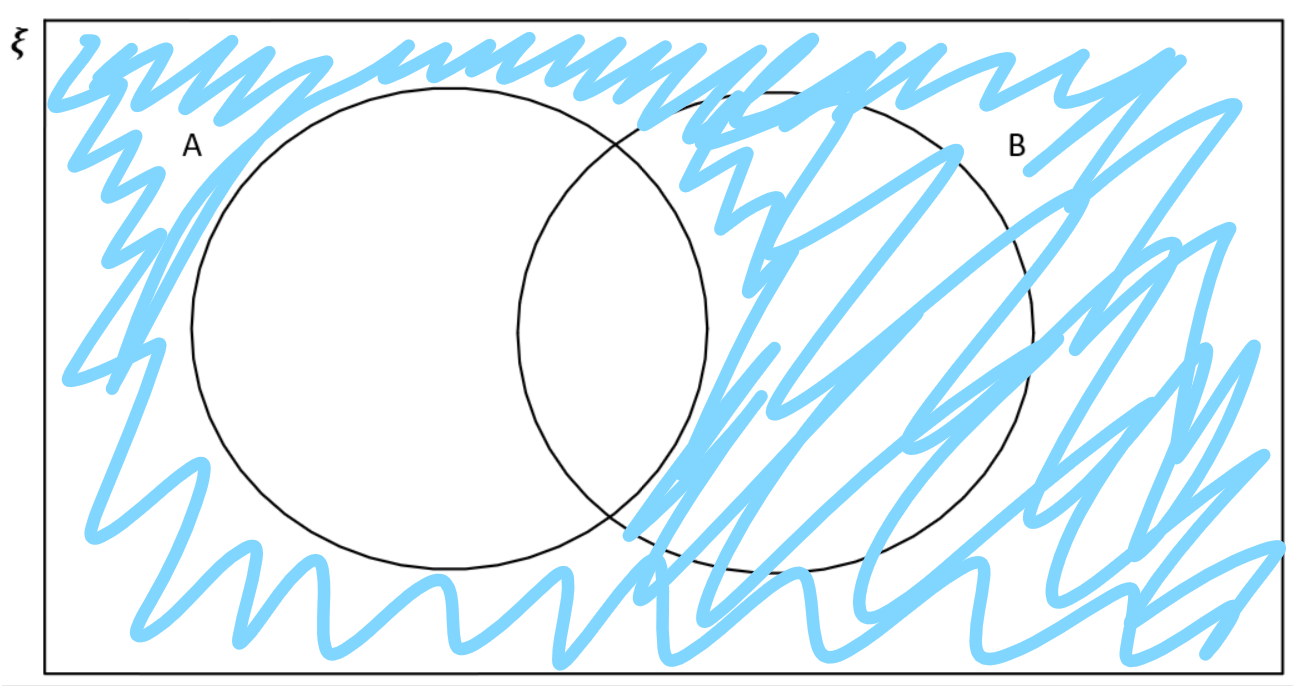
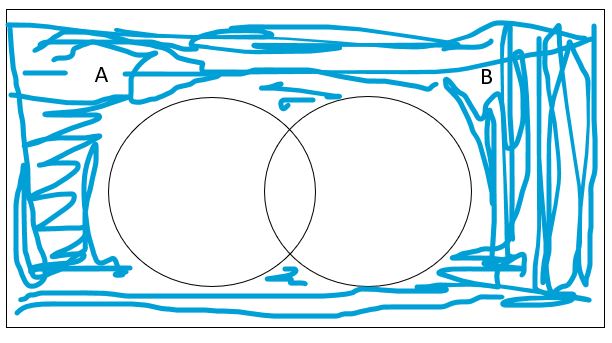
Shade the relation (AUB)’
Step 1: Shade AUB
Step 2: (AUB)’ would be the area that is not shaded in the above:
Venn Diagrams - Key takeaways
The symbol ⋃ represents the union of sets.
The symbol ∩ represents the intersection of sets.
The symbol ξ represents the sample space.
All our data points must be shown inside the sample space.


