Firstly, let's recall what do we mean by polynomials.
Polynomials are expressions involving multiple terms that contain a variable raised to a series of positive whole-number exponents. Each term may also be multiplied by coefficients.
Polynomial functions are functions that follow the standard form:
As you can see, polynomial functions in standard form are written in decreasing order, from the biggest exponent to the smallest. Also from the equation above, you can notice the following characteristics of a polynomial:
is the leading term of the polynomial, since this is the term with the highest exponent.
is the leading coefficient, because this is the coefficient of the leading term of the polynomial.
The highest power or exponent present in a polynomial is called the degree of the polynomial. In this case, the degree is n.
is a constant because this term is not accompanied by a variable.
is a polynomial of degree 2
is not a polynomial because it has a negative exponent
Evaluating polynomials
There are a couple of methods that you can use to evaluate polynomials, which are direct substitution and synthetic substitution.
Direct substitution
To evaluate a polynomial using direct substitution, all you need to do is substitute x with a number to find its solution.
Evaluate when using direct substitution
Synthetic substitution
Using synthetic substitution, the process is different. Let's evaluate the polynomial function from the previous example to explain the steps that you need to follow using this alternative method.
Evaluate when using synthetic substitution
The steps to follow with synthetic substitution are:
Step 1. Write down the coefficients of each term in the polynomial function in descending order. To the left-hand side of the leading coefficient, write down the value of x that you are evaluating the polynomial function with, as shown below.
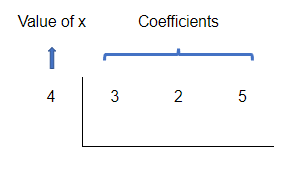
Remember to add any missing terms with a coefficient of zero (0).
Step 2. Bring down the leading coefficient below the horizontal line. Multiply the leading coefficient by the value of x. Write down the result of the multiplication just under the following coefficient. Then, add the values in the second column taking into account their signs. Write down the result of the addition directly below the horizontal line.
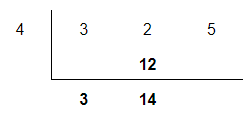
Bring down the leading coefficient, which is 3
Multiply the leading coefficient times the value of x: , and put the result under the following coefficient
Add the values in the second column:
Step 3. Multiply the result of the addition by the value of x, and put the result of the multiplication just under the following coefficient. Then, add the values taking into account their signs. Repeat this step for all the coefficients. The final value below the horizontal line will be the value of , in this case, .
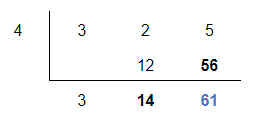
Multiply 14 times the value of x: , and put the result under the following coefficient
Add the values in the third column:
We do not need to repeat this step, because there are no more coefficients left.
Notice that this is the same result that we obtained using the previous method.
Graphing polynomials
Polynomial graphs are graphical representations of polynomial functions.
Types of polynomial graphs
There are different types of polynomial graphs according to their degree:
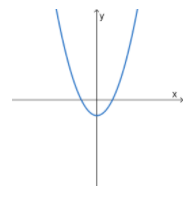
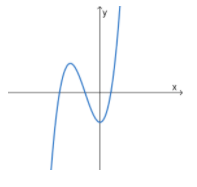
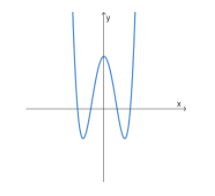
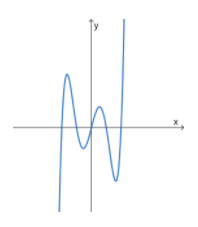
Notice that the degree of a polynomial matches the number of direction changes in their graph and the number of zeros or x-intercepts.
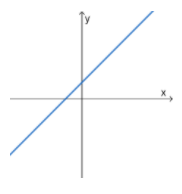
| Degree 1 - Linear | Degree 2 - Quadratic |
| 
|
| Degree 3 - Cubic | Degree 4 - Quartic |
| 
|
| Degree 5 - Quintic | Degree 6 -Hexic |
| 
|
How to solve polynomials by graphing?
As the behaviour of higher exponent functions is not as predictable as lines or parabolas, to get a more accurate representation of their curve, we need to use some key features.
Key features of polynomial graphs
1. Find the zeros: The zeros of a function are the values of x that make the function equal to zero. They are also known as x-intercepts.
To find the zeros of a function, you need to set the function equal to zero and use whatever method required (factoring, division of polynomials, completing the square or quadratic formula) to find the solutions for x. Please refer to the Factoring Polynomials article if you need a reminder of this.
After doing polynomial division and factoring of the polynomial function , we get the result .
Based on this, the zeros or x-intercepts are:
, and
If a zero appears as part of the solution twice (it is repeated), then the curve of the function will touch the x-axis at that value of x, and then bounce off the x-axis changing its direction.
2. Find the y-intercept: Substitute x = 0 in the original polynomial function. The result will be the y-coordinate where the curve crosses the y-axis.
The point where the curve of the function crosses the y-axis is (0, -12)
3. End Behavior: The curves of polynomials that have a degree of 2 or more are continuous and smooth lines that can have maximum or minimum points where they change direction in the middle section of the curve, and on either end of the curve, they tend to go towards positive or negative infinity.
How do you determine the end behavior of a function?
Leading Coefficient Test: As mentioned before, the leading term of a polynomial is the term with the highest exponent. You will need to look at whether its exponent is even or odd and the sign of its coefficient to help you determine the end behaviour of the curve.
a) Positive leading coefficient: In this case, the function will point downwards on the left and point up on the right end of the curve.
 End Behavior - odd function and positive coefficient, Marilú García De Taylor - StudySmarter Originals
b) Negative leading coefficient: In this case, the function will point up on the left and point down on the right end of the curve.
 End Behavior - odd function and negative coefficient, Marilú García De Taylor - StudySmarter Originals
a) Positive leading coefficient: In this case, the function will point upwards on both ends of the curve.
 End Behavior - even function and positive coefficient, Marilú García De Taylor - StudySmarter Originals
b) Negative leading coefficient: In this case, the function will point downwards on both ends of the curve.
 End Behaviour - even function and negative coefficient, Marilú García De Taylor - StudySmarter Originals
To sum up the end behavior of the polynomial graph we have the table below:
| Odd function | Even function |
| Sign of the Leading Coefficient | Positive | Negative | Positive | Negative |
| End Behavior | Left | Right | Left | Right | Left | Right | Left | Right |
| ↓ | ↑ | ↑ | ↓ | ↑ | ↑ | ↓ | ↓ |
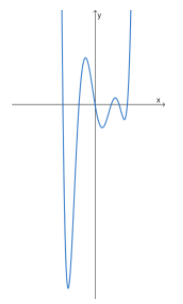
The leading term of the polynomial function is , which means that it is an odd function with a positive leading coefficient. Therefore the end behaviour of the curve will be like this:
4. Sketch the curve of the function.
 Sketch of a polynomial graph example, Marilú García De Taylor - StudySmarter Originals
Alternative method for graphing polynomials
Another way of graphing polynomials in which you do not need to have the polynomial in factored form is as follows:
Make a table of values using direct substitution of a few values of x.
Plot the points on the coordinate plane to determine the middle section of the graph.
Connect the points with a smooth and continuous curve.
Use the leading coefficient test to determine the end behaviour of the graph.
Evaluating and Graphing Polynomials - Key takeaways
- The methods that you can use to evaluate polynomials are direct substitution and synthetic substitution.
- To evaluate a polynomial using direct substitution, substitute x with a number to find its solution.
- Polynomial graphs are graphical representations of polynomial functions.
- The degree of a polynomial matches the number of direction changes in their graph and the number of zeros or x-intercepts.
- Factoring a polynomial allows you to find the zeros or x-intercepts, which are the values of x where the graph intercepts the x-axis.
- You will need to look at whether the exponent of the leading term of the polynomial is even or odd and the sign of its coefficient, to help you determine the end behaviour of the curve.


