The equation is quadratic because the base 'x' is not defined but its power is defined as '2' .
However, in exponential Equations, the base is given but the power is not defined:
The equation is exponential because the base is given as '2' while its power 'x' is undefined .
The general algebraic equation of an exponential function is:
Where a is not equal to 0, b is the base and a positive real Number not equal to 1, and x is the exponent.
Note that the base of an exponential expression is called a multiplier .
Exponential growth and exponential decay are two types of exponential Functions.
What is exponential growth and decay?
Exponential growth takes place when the amount of a substance increases at the same rate within equal time frames.
Examples include the multiplication of bacteria, a population of people etc. However, exponential decay happens when the amount of a substance reduces at the same rate over equal time intervals.
Identifying exponential growth and exponential decay?
Exponential growth and decay can be distinguished from each other or identified mathematically.
If you consider the general formula:
When a is a positive value and 'b' is the base greater than 1, then it is exponential growth. For example:
note that b = 2, and 2> 1
or
note that b = 3, and 3> 1
Meanwhile, when a is positive and 'b' is less than 1, then it is exponential decay. For example:
note that b = 0.2, and 0.2 <1
or
note that b = 0.3, and 0.3 <1
Note that in cases where a is negative, it is neither an exponential growth nor decay.
Examples of Exponential Equations
Calculate the value of the expression when x = 2.
Solutions:
Substitute the value of x as 2 in
= 25
evaluate when x = 4
Solutions:
Substitute the value of x as 4 in the expression
Recall that exponentials are to be solved before multiplication
= 81
= 810
Exponential growth and decay graphs
Introducing Graphs into exponential growth and decay shows what growth or decay looks like. In both cases, you choose a range of values, for example, from -4 to 4. These values will be plotted on the x-axis; the respective y values will be calculated by using the exponential equation.
Also, do not forget that the b value in the exponential equation determines if it is a growth or decay. For b > 1, it is a growth; and for b <1, it is a decay. To help you remember, the b value is in bold in all equations.
Examples of exponential growth and decay graphs
Example 1:
Graph the exponential equation
Solutions:
Remember to choose a range of values for your x coordinates like -4 to 4 in this case.
So, we need to solve for the value of y. Remember that
When x = -4
(note that indices, an exponent with a negative sign gives an inverse of the expression )
y = 1/81
Repeat this step for the values x = -3, -2, -1, 0, 1, 2, 3 and 4 and your answer would be 1/27, 1/9, 1/3, 1, 3, 9 , 27 and 81.
Now you can complete your table:
| x | -4 | -3 | -2 | -1 | 0 | 1 | 2 | 3 | |
| | 1/81 | 1/27 | 1/9 | 1/3 | 1 | 3 | 9 | 27 | 81 |
You can see that the y values increase from the left to the right of the table. This means that there has been growth . Go ahead and plot the graph below:
 A graph of exponential growth for b> 1
From the exponential growth graph, the following can be observed:
The graph increases steeply as the value of x becomes positive.
There is no x-intercept as the curve fails to intersect with the x-axis even as y values come close to the x-axis.
The curve intersects the y-axis at 1. So, the y-intercept is 1 (where the x value is 0).
Example 2:
Graph the exponential equation
Solutions:
Remember to choose a range of values for your x coordinates like -4 to 4 in this case.
So, we need to solve for the value of y. Recall that
When x = -4
(note that indices, an exponent with a negative sign gives an inverse of the expression )
y = 81
Repeat this step for the values x = -3, -2, -1, 0, 1, 2, 3 and 4 and your answer would be 27, 9, 3, 1, 1/3, 1/9, 1/27 and 1/81.
Now you can complete your table:
| x | -4 | -3 | -2 | -1 | 0 | 1 | 2 | 3 | 4 |
| 81 | 27 | 9 | 3 | 1 | 1/3 | 1/9 | 1/27 | 1/81 |
A quick look tells you that the y values decrease . This means that there has been decay . Go ahead and plot the graph below:
 A graph showing exponential decay for b <1
![]()
The following can be understood from the exponential decay graph:
- The curve decreases as the value of x increases.
- Like the growth graph, there is no x-intercept.
- The curve intersects the y-axis at 1 when x is 0. The y-intercept is 1.
Let's plot exponential Graphs with the function for exponential .
If you follow all the steps which have been explained earlier, your graph should look like this:
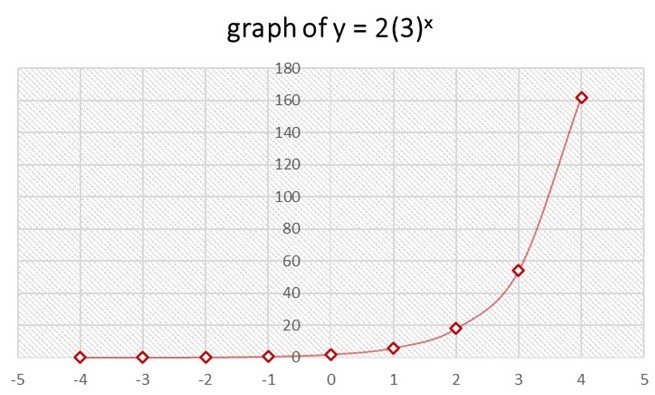
A graph of exponential growth for a> 1 and b> 1
Let's look at a combination of the exponential equations in the graph below:
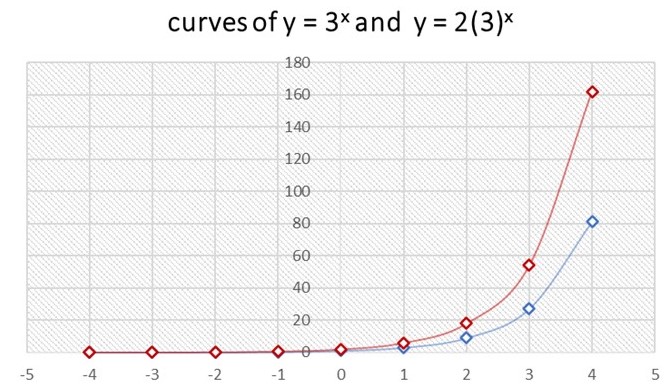
A graph showing the increasing effect of a = 2 on an exponential growth curve ![]()
You will observe that both equations follow the same pattern of increase with no x-intercepts but with y-intercepts = 1 and 2 in the respective equation. This is easily observed when you compare tables of these equations; when x = 0, y = 1 in the first equation and y = 2 in the second equation. Also, we note that the curve has been increased by a multiplying factor of 2 in the curve .
We would make another comparison between when a in the equation is positive and negative.
Let's consider these two equations:
other
Study the graph below:
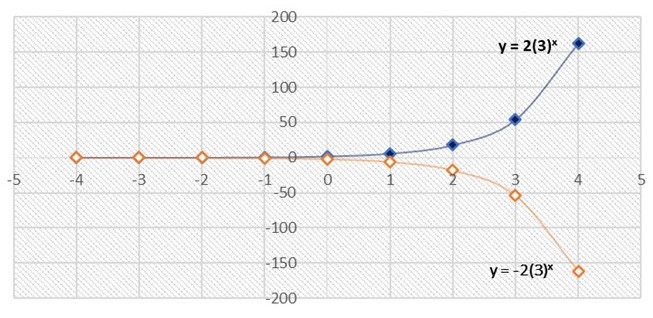
A graph showing a comparison between positive and negative a values![]()
From the graph above, we note that for positive values of a the y values are positive (y> 0). However, when a is negative, y gives a negative result (y <0).
Simple applications of exponential growth and decay
In applying the idea of exponential growth and decay, little changes will be made to the general formula:
remember that b is the base that represents the growth factor or decay factor. this will be:
b = 1 + r for exponential growth
or
b = 1 - r for exponential decay
1 represents 100% and r represents the rate of increase in percentage.
Also, x will be changed to t which represents the time interval . Thus, the general equation changes to:
for exponential growth
or
for exponential decay
where y is the final amount, a is the starting value, r is the rate of increase and t is the time interval.
Note that the expression 1 + r or 1 - r is also referred to as the multiplier .
Examples of simple applications of exponential growth and decay
Example 1:
James bought $200 worth of stock from an automobile company in Japan at the end of the year, and it is expected that the stock value is to increase by 25% annually.
a. Derive an exponential function that expresses James' stock value in t years
b. After 6 years, Mary purchased all of the same stock owned by James for $1000. How much has James gained or lost?
Solutions:
a. To decide what formula to apply, you need to know if there is an increase or decrease in the rate. In this case, there is a 25% increase.
So, we apply
Let's define components of the formula
y is not given
a is $200
r is 25% = 0.25
t is given as t
Thus,
so James 'stock value y in t years' time would be dollars.
b. Since we have the equation expressing the exponential function of James' stock in t years, it would be easy to find his stock value in 6 years.
Thus, t = 6
Substitute the value of t as 6 in the equation:
Meanwhile, Mary purchases his stock of 6 years at the value of $1000 . This clearly shows that James has gained $1000-$763 = $237.
Example 2:
A certain parasite is said to double in the human body every six months. If the current population is 100 in an infected individual, what is expected to be the population of this parasite in the individual after two years if left untreated?
Solutions:
Watch out for the detail that this increase occurs every 6 months. This means per year, it increases twice.
Also, note that the rate of increase is double, which means that it is a 100% increase.
Remember that 1 in (1 + r) means 100%.
Since the parasite doubles, it means an additional whole increase, ie 100% + 100%.
b = 1 + r = 1 + 1 = 2
so, the growth factor is 2.
Thus,
note that we are having a product of 2 and 2 because the increase occurs twice in two years
So, in 2 years, the parasite in the individual would have increased from 100 to 1600.
Therefore, when there is a doubling increase, b = 1 + r = 2; similarly, when the increase is triple, b = 3 and so on.
Frequency of exponential growth and decay
You should recall from the last example the Number of times the parasites increased. In some cases, the frequency or number of times an increase or decrease occurs may not be once within a time interval. So, the formula would have to be altered to accommodate this.
where n is the frequency at which the increase or decrease occurs.
Refer back to Example 2 about the parasites:
a = 100
r = 2 because the parasite doubles
n = 2 the increase occurs every 6 months, which means it occurs twice a year
t = 2 years
y = 1600
Let's have a look at the opposite situation. Imagine this individual took an antibiotic which has the effect of reducing the parasite population by half every 6 months. What would be the population of the parasite if this person remains on the antibiotic for 3 years?
Solutions:
a = 100
r = 0.5 because the parasite reduces by half
n = 2 because this reduction takes place twice a year (every 6 months)
t = 3 years
In 3 years, the parasite would have reduced its population from 100 to around 2.
Real-life application and examples of exponential growth and decay
The understanding of exponential growth and decay has several everyday uses. It has been applied in calculating appreciation, depreciation, compound interests, the half-life of elements etc.
Exponential growth in compound interest
Compound Interest is modeled according to the principle of an exponential function. The formula for Compound Interest is:
Where A = amount of investment
P = principal
r = Interest rate
n = number of times the Interest is compounded
t = duration of time in years
From the above formula, you can easily see that compound interest is an example of exponential growth.
Calculate the final amount of on a $30,000 investment for 5 years at 8% interest rate compounded quarterly.
Solutions:
P=$30,000
r = 8% = 0.08
n = quarterly = 4
t = 5 years
A = $30,000 (1 +0.02) 20
A = $30,000 (1.02) 20
A = $30,000 (1.4859)
A = $44,578 to the nearest dollars .
Exponential decay in depreciation and appreciation
When the value of a product falls, it is said to have depreciated. However, if the value of a product rises, we say it has appreciated. The principle of exponential decay is applied in depreciation and appreciation. You should use the formula:
for depreciation
A = the depreciated amount
V = current value of the product
r = rate
n = the duration of time in years
or
for appreciation; but, A = appreciated amount
In 2016, a Toyota Tundra truck was bought for $34,000 by Imisi with an annual depreciation rate of 20%. What would Imisi's truck be worth in 2021?
Solutions:
v=$34,000
r = 20% = 0.2
n = 2021 - 2016 = 5 years
A = $34,000 (1 - 0.2)
Look into the exponent 5 throughout and make corrections
A = $
A = $34,000 (0.3277)
A = $11,141 to the nearest dollar.
Growth and Decay - Key takeaways
- Exponential growth and decay enable us to find the rate of rapid increase or decrease.
- The general algebraic formula for exponential growth and decay is:
- b = 1 + r in exponential growth while b = 1 - r in exponential decay.
- In exponential growth, b> 1 and a is a positive number. But in exponential decay b <1 and a is a positive number.
- Exponential growth is applied in real life to calculate compound interest, population increase in humans and parasites.
- Exponential decay is applied in determining depreciation, the half-life of elements as well as the life span of organisms.


