When an individual gets infected with Covid-19, you can determine the rate at which the virus spreads given a specific period of time.
In this article, you shall understand the rate of change and its applications.
Rates of change meaning
The rate of change is defined as the relationship linking the change that occurs between two quantities.
It is known as the gradient or slope when changes occur during the comparison of two quantities.
The concept of rate of change has been widely used to derive many formulas like that of velocity and acceleration. It tells us the extent of activity when there are alterations in the quantities that make up such activities.
Suppose a car covers a distance of A meters in n seconds.
From point A it covers another distance B at the mth second, we notice then that there are changes between the distance A and B as well as differences between the nth and mth second.
The quotient of these differences gives us the rate of change.
What is a change in mathematics?
In mathematics, a change takes place when the value of a given quantity has been either increased or reduced.
This implies that change can be either positive or negative. There is a zero change when the value of a quantity does not change.
Imagine you have 5 oranges right now and later in the day you have 8 oranges. What just happened? Is there a change? Surely, there is a change because your total number of oranges just increased by 3 oranges. As a matter of fact, this is a positive change.
In contrast, consider you have 5 oranges at the moment and much later in the day you have an orange left. This suggests that you have experienced a reduction of 4 oranges. Thus, we say you have experienced a negative change.
This suffices to note that change is basically the difference in quantities calculated as,
where
is the change in quantity,
is the initial value of the quantity,
is the final value of the quantity.
Whenever ΔQ is positive it means there is a positive change, however, when ΔQ is negative it implies a negative change.
Since you know what a change is, we are now ready to calculate the rate of change.
Rates of change formula
To calculate the rate of change, we calculate the quotient between the changes in the quantities. This means,
Further to the derivation of this formula, we shall take the directions on a graph as a guide. Let us consider that changes are made in both the horizontal direction (x-axis) and the vertical direction (y-axis).
In the horizontal direction, a change will imply
where,
is the change in the horizontal direction (x-axis),
is the initial position on the x-axis,
is the final position on the x-axis.
Likewise, in the vertical direction, a change will imply,
where,
is the change in the vertical direction (y-axis),
is the initial position on the y-axis,
is the final position on the y-axis.
Therefore, the rate of change formula becomes,
If the value of a quantity at the start recorded 5 units horizontally and 3 units vertically, thereafter, it recorded 8 units horizontally and 4 units vertically, what is the rate of change?
Solution
From the information given, we have
is 5, is 8
is 3, is 4
Thus,
Rates of change of a function
The rate of change of a function is the rate at which a function of a quantity changes as that quantity itself changes.
Let w be a function of u, expressed as
.
The rate of change of the function w tells us the rate at which w changes and u changes, knowing that w is an expression of u.
The change in is expressed as
where,
is the change in the value of ,
is the initial value of ,
is the final value of ,
Similarly, the change in is given by
But,
thus we have,
Therefore the rate of change of a function formula would be,
The formula used in calculating the rate of change of a function is,
where,
is the change in the horizontal direction (x-axis),
is the initial position on the x-axis,
is the final position on the x-axis,
is the change in the vertical direction (y-axis),
is the function of the initial position on the x-axis,
is the function of the final position on the x-axis.
Rates of change on a graph
Representing rates of change on a graph requires representing quantities on a graph. Ideally, there are three types of graphs that are based on three different scenarios. They are the zero, positive and negative rate of change graphs as would be explained below.
Zero rates of change
The zero rates of change occur when the quantity in the numerator changes and it does cause any change to the second quantity. This takes place when
.
The graph below illustrates the zero rate of change.
 An illustration of zero rates of change when no change occurs in the y-direction - StudySmarter Originals
We notice that the arrow is pointing rightwards horizontally, this suggests that there is a change in the x-values but the y-values are unchanged. So the y-values are not affected by changes in x and as such the gradient is 0.
Positive rates of change
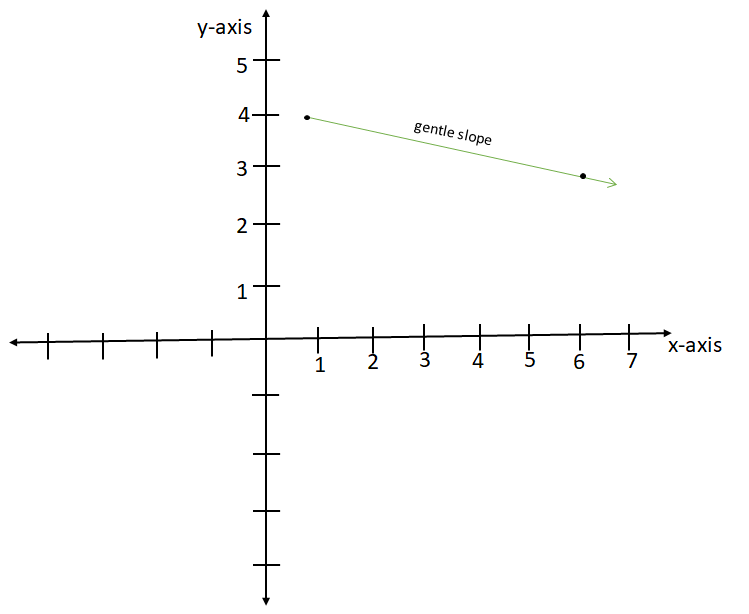
Positive rates of change occur when the quotient of the changes between both quantities is positive. The steepness of the slope is dependent on which quantity experiences a greater change relative to the order quantity.
This means that if the change in the y-values is greater than that of the x-values, then the slope will be gentle. In contrast, when the change in x-values is greater than that of the y-values, then the slope would be steep.
Note that the direction of the arrow pointing upwards reveals that the rate of change is indeed positive. Give a quick look at these figures below to understand much better.
 An illustration of a gentle sloped positive rate of change - StudySmarter Originals
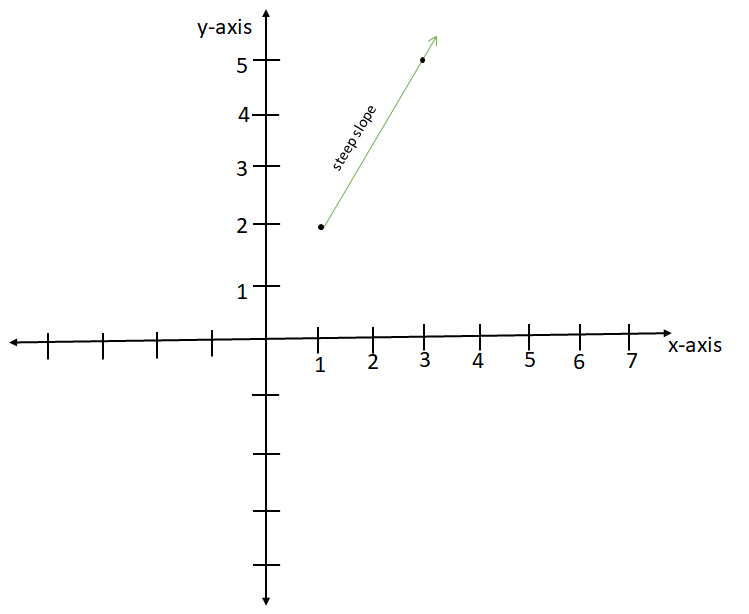
An illustration of a positive steep-sloped rate of change - StudySmarter Originals
Negative rates of change
Negative rates of change occur when the quotient of the changes between both quantities gives a negative value. For this to occur, one of the changes must produce a negative change while the other must give a positive change. Beware that when both changes produce negative values, then the rate of change is positive and not negative!
Again, the steepness of the slope is dependent on which quantity experiences a greater change relative to the order quantity. This means that if the change in y-values is greater than that of the x-values, then the slope will be gentle. In contrast, when the change in x-values is greater than that of the y-values, then the slope would be steep.
Note that the direction of the arrow pointing downwards reveals that the rate of change is indeed negative. Take a quick check on these figures below to understand much better.
An illustration of a negative gentle-sloped rate of change - StudySmarter Originals
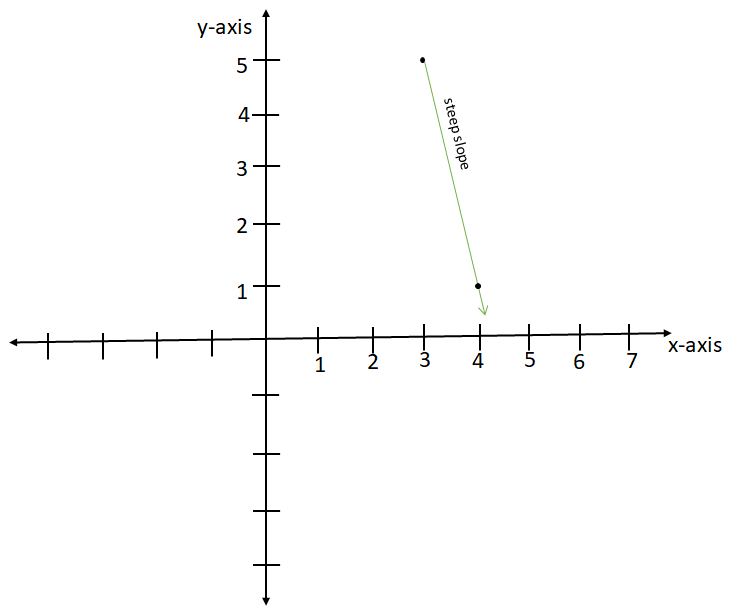
An illustration of a negative steep-sloped negative rate of change - StudySmarter Originals
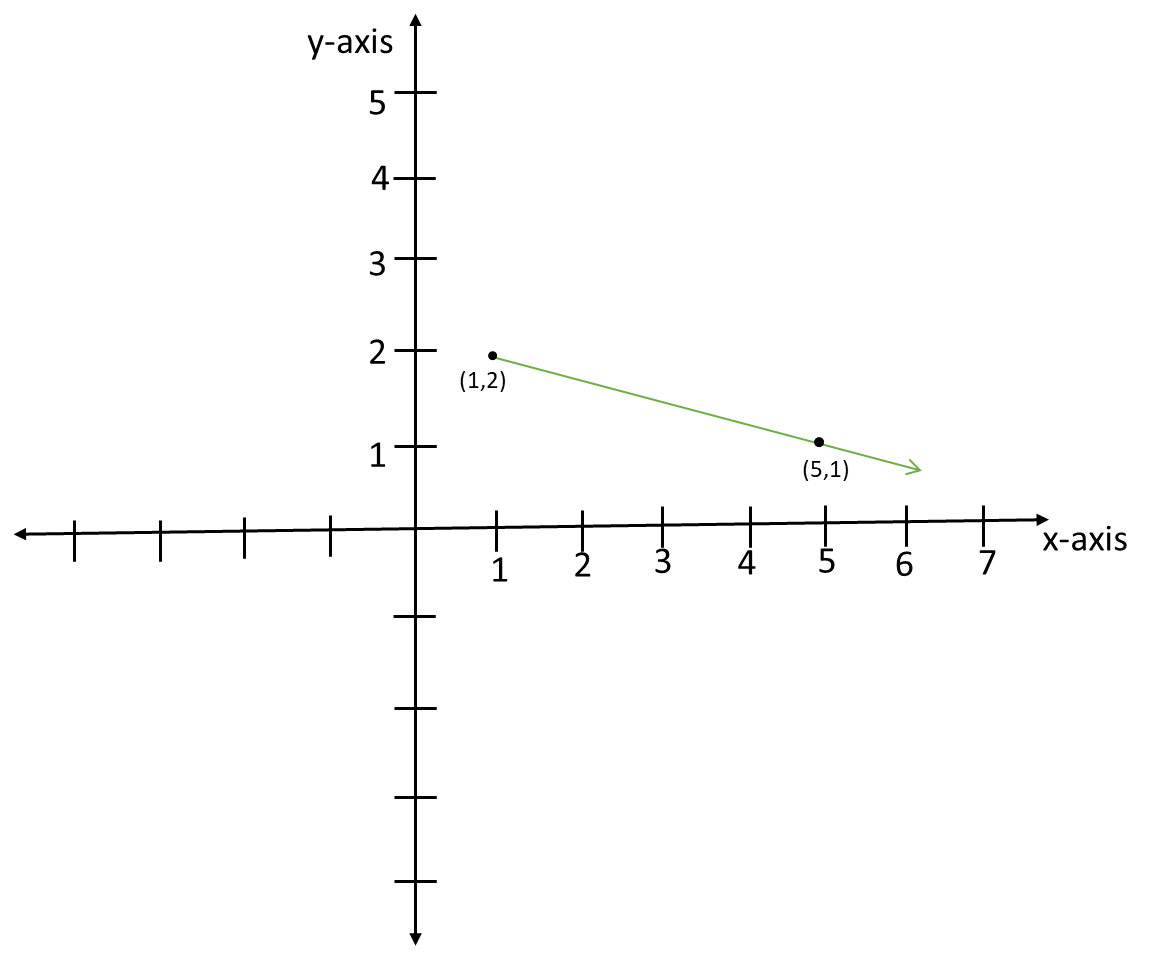
Calculate the rate of change between two coordinates (1,2) and (5,1) and determine
a. The type of rate of change.
b. Whether the slope is steep or gentle.
Solution
We have ,
In order to sketch the graph, we plot the points in the coordinate plane.
Now, in order to calculate the rate of change, we apply the formula,
a. Since our rate of change is -4, thus, it has a negative rate of change.
b. We notice that the change towards the y-direction (4 positive points) is greater than the change in the x-direction (1 negative step), therefore, the slope when plotted on a graph would be gentle as shown in the figure.
Rates of change examples
There are practical applications of rates of change. A good application is in the determination of speed. An illustration below would elaborate better.
A car starts from rest and arrives at a point J which is 300m from where it started in 30 seconds. At the 100th second, it reaches a point F which is 500m from his starting point. Calculate the average speed of the car.
Solution
Below is a sketch of the journey of the car.
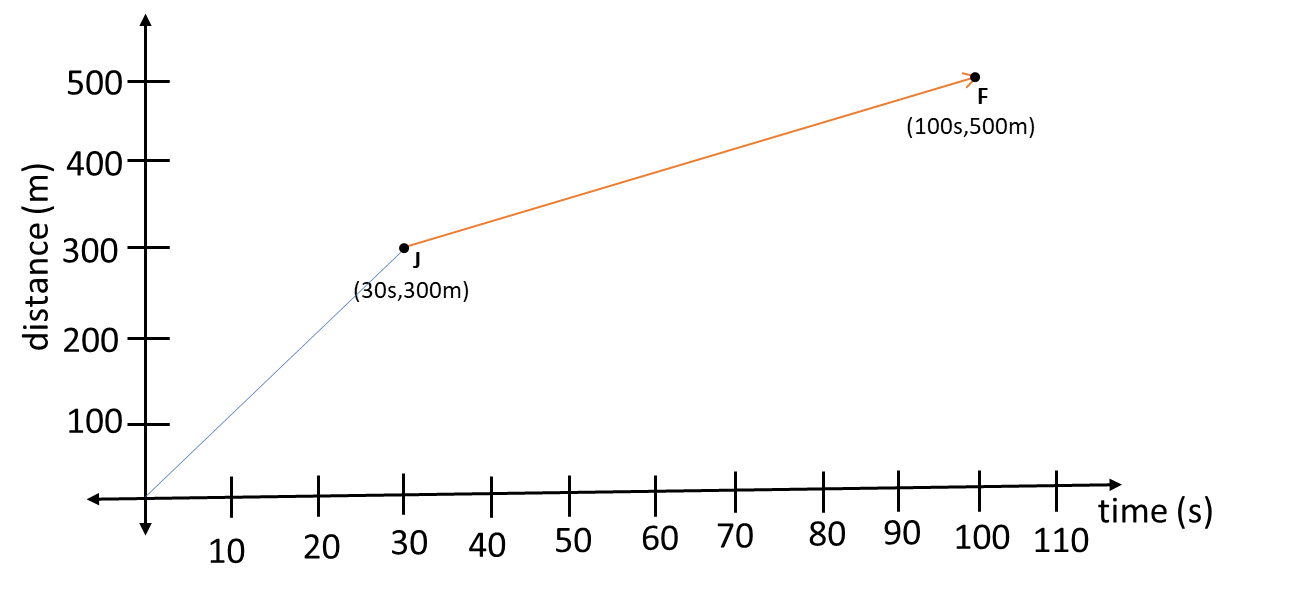
The average speed of the car is equivalent to the rate of change between the distance travelled by the car and the time it took.
Thus;
Therefore, the average speed of the car is 2.86ms-1.
Rates of Change - Key takeaways
- The rate of change is defined as the relationship linking the change that occurs between two quantities.
- A change takes place when the value of a given quantity has been either increased or reduced.
- The formula used in calculating the rate of change is;
- The rate of change of a function is the rate at which a function of a quantity changes as that quantity itself changes.
- Representing rates of change on a graph requires representing quantities with points on a graph.


