Rational functions are functions expressed as fractions where both the numerator and denominator are polynomials.
Recall that polynomial functions are functions containing variables with coefficients. For example, the function is a polynomial function.
The following are rational functions:
, , ,.
The following are not rational functions:
,
Because we are dealing with fractions, we need to be aware that the denominator cannot be zero and thus need to be careful of single points or values that may not be valid.
The function is rational as it is expressed as a fraction where both the numerator and denominator are polynomial expressions. However, if we specifically look at the function when, we notice a problem. Since it is impossible to divide by zero, we notice that the function is undefined. In the section below, we will talk about how we can represent these undefined parts by representing them as asymptotes.
Graphing Rational functions with Horizontal and Vertical Asymptotes
The first thing we need to talk about in our discussion of graphs of rational functions is the idea of an asymptote.
Asymptotes are lines that a curve can get infinitely close to but never quite reach and they can be vertical, horizontal or oblique.
We graph asymptotes as dashed lines. An asymptote is a vertical asymptote when the curve approaches infinity as x approaches some constant value. An asymptote is horizontal when the curve approaches some constant value as x tends towards infinity. Oblique asymptotes take the form , where m and b are constants to be determined. However, for the purposes of this article, we will focus solely on vertical and horizontal asymptotes.
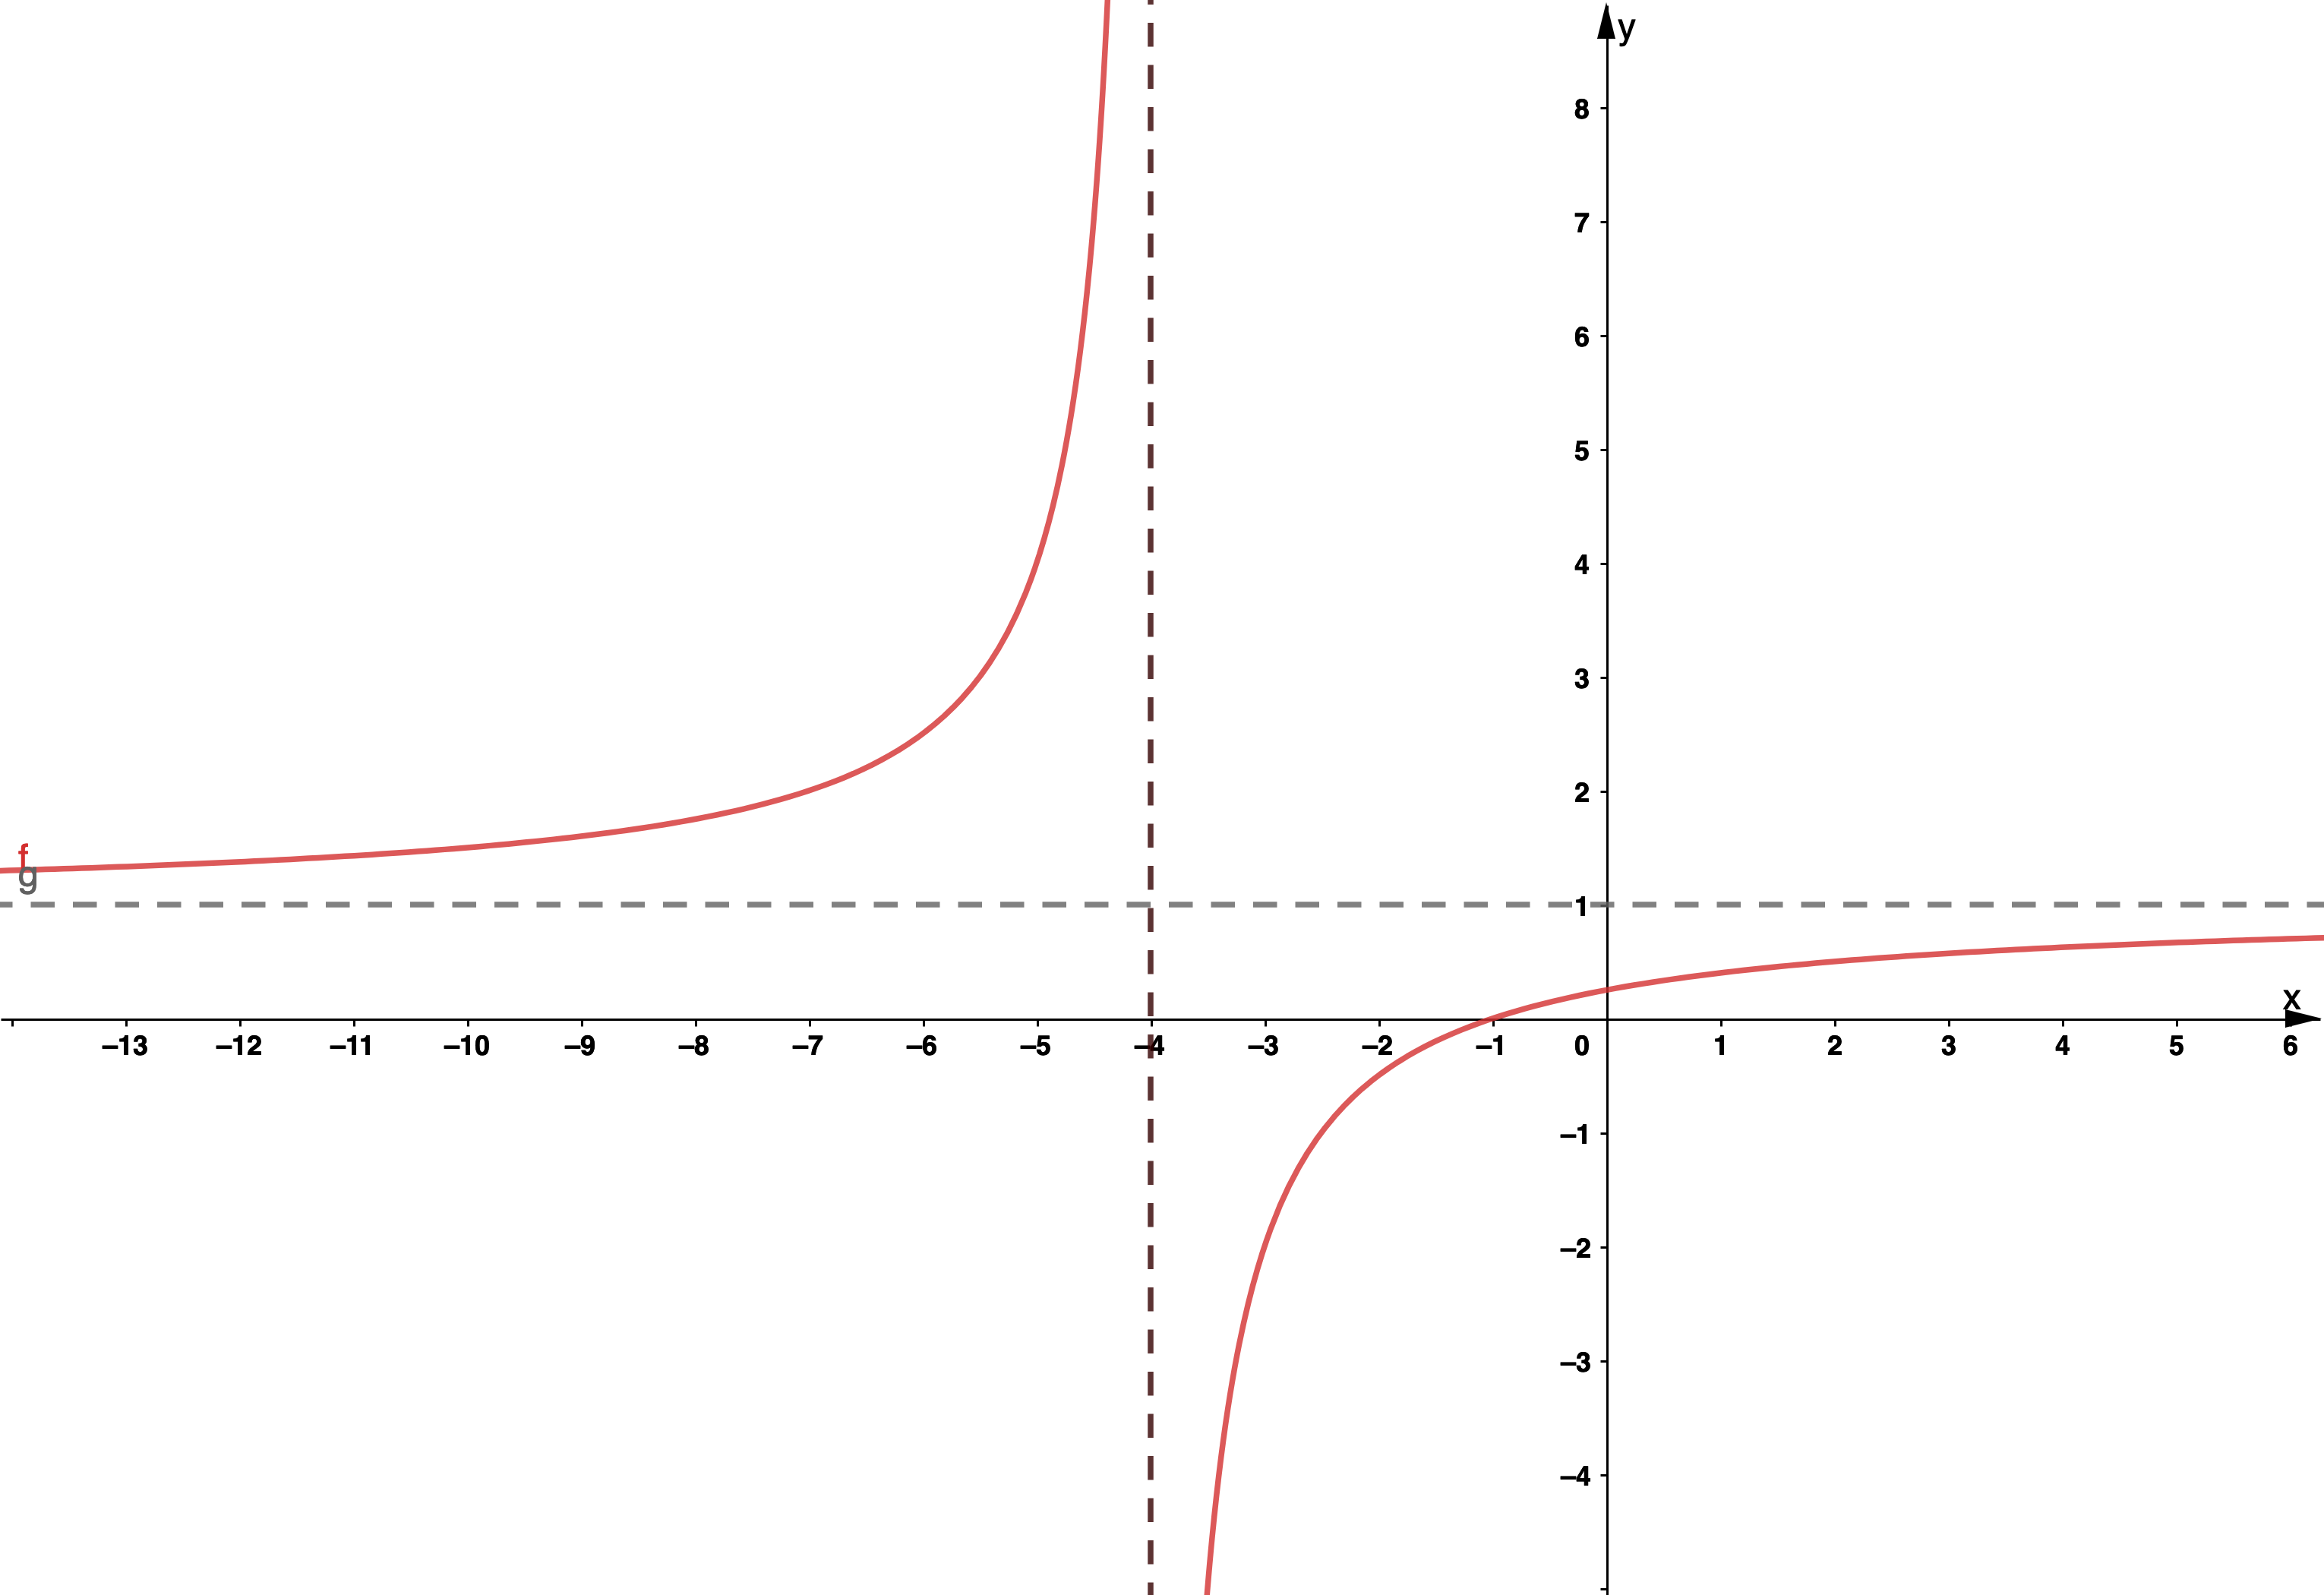
Graph showing vertical and horizontal asymptote, Jordan Madge- StudySmarter Originals
Above is the graph of . We can see a vertical asymptote at since the graph tends towards this line but never quite reaches it. Similarly, we can see a horizontal asymptote at . In the next section, we will learn how to determine vertical and horizontal asymptotes for any graph.
Determining Vertical and Horizontal Asymptotes
Determining any vertical and horizontal asymptotes that a rational function may have is a key step to graphing rational functions. The method for finding a vertical asymptote is different from finding a horizontal asymptote, so we will go through the two methods here.
Finding Vertical Asymptotes
As previously mentioned, a vertical asymptote is a value of x that a graph will tend towards but never quite reach because if it does, it will lead to divisibility by zero problems. Therefore, to find the vertical asymptotes, we need to set the denominator equal to zero and solve for x.
Find the vertical asymptote for the function
Solution:
Equating the denominator to zero, we obtain that and thus .
Find the vertical asymptotes for the function
Solution:
Equating the denominator to zero, we obtain that and factoring results in . Then, using the zero product property, are the equations of the two vertical asymptotes.
Find the vertical asymptotes for the function .
Solution:
Equating the denominator to zero, we obtain , and factoring results in. Then, using the zero product property are the equations of the two vertical asymptotes.
Finding Horizontal Asymptotes
To find horizontal asymptotes, we need to determine the value or values that the function tends towards as x approaches . To establish a method to find such values, we must first outline a key term: the degree of a polynomial. The degree of a polynomial is the order of the highest power. So, the polynomial is a degree 3 polynomial as the order of the highest power is 3.
There are three possible cases when determining the horizontal asymptotes, summarized in the table below.
| Case | Degree of Numerator | Horizontal asymptote |
| 1 | The degree of the numerator is the same as the degree of the denominator. | The horizontal asymptote is found by dividing the coefficients of the highest power of x. |
| 2 | The degree is the numerator is less than the degree of the denominator. | The horizontal asymptote is at |
| 3 | The degree of the numerator is higher than the degree of the denominator | There is no horizontal asymptote. |
Find the horizontal asymptote, if any, for the function .
Solution:
In this case, the degree of the numerator is 2 and the degree of the denominator is also 2. Since the degree of the numerator is the same as the degree of the denominator, the horizontal asymptote is found by dividing the coefficients of the highest power of x. In this case, the coefficient of is 1 on both the numerator and denominator and so the horizontal asymptote is .
Find the horizontal asymptote, if any, for the function .
Solution:
Since the degree of the numerator is 1 and the degree of the denominator is 3, we have the case 2 and thus the horizontal asymptote is just .
Find the horizontal asymptote, if any, for the function id="2620569" role="math" .
Solution:
Since the degree of the numerator is 7 and the degree of the denominator is 4, we have case 3 and thus there is no horizontal asymptote as the function will approach infinity.
y-intercepts and zeroes
Another key step to graphing rational functions is to find the graph intercepts. In general, when graphing any function- rational or not- it is helpful to find the graph intercepts. The x-intercept can be found by finding the value of x when and the y-intercept can be found by finding the value of y when . Another word for the x-intercept is called the zero of a graph.
Find both the x and y-intercepts of the function with equation
Solution:
When , we have that . Multiplying both sides by , we obtain and then factoring this yields . Using the zero product property, we can see that the x-intercepts are at and .
When , we can see that and so the y-intercept is at .
Graphing Rational Functions Examples
We have so far been over a few key concepts regarding the graphs of rational functions, so we will now put them all together to determine how to graph a rational function. Look at the steps involved in graphing rational functions.
Step 1: Find the asymptotes of the rational function.
Step 2: Draw the asymptotes. These are represented as dashed lines rather than solid lines.
Step 3: Find any x and y-intercepts of the rational function (Note that there may not be any x or y-intercepts).
Step 4: Choose some values of x and find the corresponding values of y. Choose integer values of x that fall on both sides of the vertical asymptote.
Step 5: Plot the intercepts and points and draw in a smooth curve.
Graph the rational function .
Solution:
To answer this question, we will go through the above steps.
Step 1: Find the asymptotes.
Equating the denominator to zero, we find that and thus . Therefore, we have a vertical asymptote at . Note that the degree of both the numerator and denominator is 1 and therefore we have one horizontal asymptote at .
Step 2: Draw in the asymptotes.
Below the asymptotes are sketched using dashed lines.
 Example showing asymptotes, Jordan Madge- StudySmarter Originals
Step 3: Find any x and y-intercepts.
When , .
When , and so and hence .
Thus, there is a y-intercept at (0,2) and a x-intercept at (-16,0).
Step 4: Choose some values of x and hence find the corresponding values of y.
Looking at our sketch so far, we have a vertical asymptote at id="2620632" role="math" . Therefore, we should choose values of x on both sides of this asymptote.
x | -8 | -6 | -2 | 2 | 6 | 8 |
y | -1 | -2.5 | 3.5 | 1.5 | 1.1 | 1 |
Step 5: Plot the intercepts and points and draw in a smooth curve.
 Graph of function example, Jordan Madge- StudySmarter Originals
Graphing Rational Functions - Key takeaways
A rational function is a function expressed as a fraction of two polynomials.
Rational functions often have asymptotes.
An asymptote is a line that a curve will tend towards as it tends to infinity.
Asymptotes can be vertical, horizontal or oblique and are represented as dashed lines.
To sketch a rational function, you first need to determine any asymptotes and plot them. You then need to determine any intercepts that the graph may have, as well as some general points on the curve. Once plotted, a smooth curve can be drawn through the points.


