Properties of Trigonometric Graphs
There are three graphs that we are interested in when studying the graphs of trigonometric functions: the graphs of sin(x), cos(x) and tan(x). For GCSE mathematics, you kind of need to memorise what these graphs look like. However, they do have some key properties that make them quite simple to draw. We will start with the graph of .
The graph of y=sin(x)
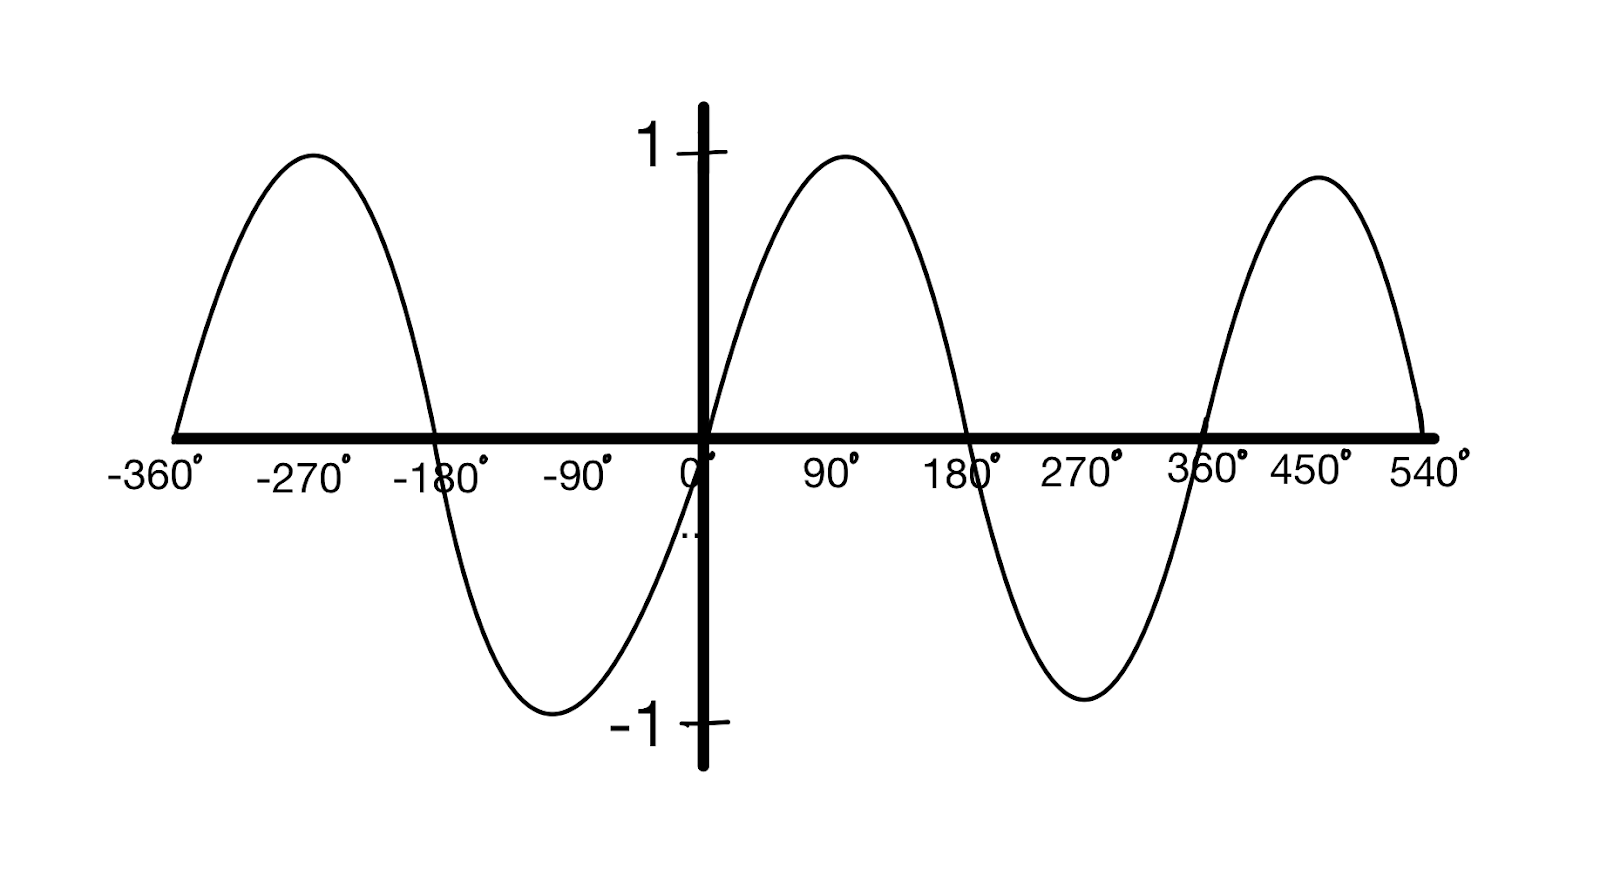
Graphs of Trigonometric Function- Graph of y=sin(x), Jordan Madge- StudySmarter Originals
Key properties
We can see that the graph of y=sin(x) has a maximum value of 1 and a minimum value of -1. From this, we can conclude that the value of sin(x) can only fall between 1 and -1. Thus, if we have an equation where , the equation has no solutions.
The x values go up in 90-degree intervals and periodically repeat on a 360-degree cycle. In other words, after every 360 degrees, we notice that the graph repeats itself.
At various points, the graph is symmetrical. For example, we have symmetry about the line . This will be useful to us later on when finding multiple solutions to trigonometric Equations.
Suppose . Looking at the graph, we can see that at , and . Since the graph of will continue to oscillate infinitely, we could conclude from this that the equation has an infinite Number of solutions. If a trigonometric equation has one solution, it will have an infinite Number of solutions and later on we will use the symmetry property to try to find such solutions.
The official name of a graph that takes the shape of a sine graph is a sinusoidal wave. Many things naturally take the shape of a sine wave, for example, the movement of planets around the sun.
The graph of y=cos(x)
 Graphs of Trigonometric Function- Graph of y=cos(x), Jordan Madge- StudySmarter Originals
Key properties
If you were not paying close attention in the last section, you may think that this graph is pretty much the same as the graph of . However, if you go back and play a game of spotting the difference, you will notice that the graph of is just the graph of shifted 90 degrees to the left.
Similarly to , the graph of also has a maximum at , a minimum at , and also a symmetry property. We must just remember that the graph of starts at , whereas the graph of starts at .
The graph of y=tan(x)
 Graphs of Trigonometric Function- Graph of y=tan(x), Jordan Madge- StudySmarter Originals
Key properties
The graph of looks quite a fair bit different to and . However, it is similar in the sense that it is periodic, and we can see that it repeats itself every degrees.
The graph of has these things called asymptotes, which are points that the graph tends towards but never quite reaches. These are represented on the graph as dashed lines. We can see the first positive asymptote appears at , and then they repeat every degrees.
Unlike and , the graph of does not have a maximum or minimum of plus or minus ; it has a maximum and minimum of plus or minus infinity. Thus, the equation can be solved to obtain an infinite number of real values for x.
Finding solutions to trigonometric equations
In the previous section, we briefly touched upon the fact that if a trigonometric equation has one solution, it will have an infinite number of solutions. In the below section, we will be working out how to find multiple solutions to trigonometric Equations.
Since trigonometric equations can have an infinite number of solutions, we need to specify a boundary when stating answers so that we do not spend an infinite amount of time finding every last solution. This boundary will usually be expressed as an interval, for example, , or . Be sure to take note of this boundary when answering questions.
Graphs of Trigonometric Functions Examples
Find the solutions to , for the interval .
Solution:
The first step is to sketch the graph of and on the same axis for the interval .
 Graphs of Trigonometric Functions- Graph showing solutions of sin(x)=0.9, Jordan Madge- StudySmarter Originals
The points of intersection have been labelled in orange as 1 and 2, these are the solutions we are seeking to find the exact values of.
The second step is to find the exact value of the initial solution. This can be done by typing into our calculator. When we do this, we obtain . This is clearly the first solution labelled on the diagram since it is between and .
It is important to note that your calculator should be in degree mode when calculating trigonometric values since we are working in degrees. If your calculator is in radian mode, the answer may vary and so you may obtain the incorrect answer. You know that your calculator is in degree mode when a small D appears on the top of the screen. If you see an R or any other letter, it is in the wrong mode and needs to be changed.
The next step is to find the other solution using the symmetrical property of the graph of sin(x). If we notice, the graph is symmetrical about id="2569857" role="math" . Thus, we can work out the second solution by working out the distance between and , and then adding this value to . This can be illustrated in the below diagram:
 Graphs of Trigonometric Functions- Graph showing solutions of sin(x)=0.9, Jordan Madge- StudySmarter Originals
Since the distance between and is , the second solution is id="2569881" role="math" . Therefore, the two solutions to the equation in the interval are id="2569884" role="math" and id="2569885" role="math" .
Find the solutions to for the interval .
Solution:
The first step is to sketch the graphs of and id="2569887" role="math" on the same axes for the interval so that we can see the solutions we are trying to find.
 Graphs of Trigonometric Functions- Graph showing solutions of cos(x)=-0.2, Jordan Madge- StudySmarter Originals
The next step is to find the initial solution by typing into our calculator. We obtain id="2569892" role="math" . Clearly, this is the solution labelled 2 on the diagram, since it is a little more than id="2569898" role="math" but less than id="2569899" role="math" .
We now need to find the other solution depicted in the diagram. Since the graph of is symmetrical about the line , we can see that the other solution must be at id="2569894" role="math" . Thus, the two solutions to id="2569895" role="math" in the interval are id="2569897" role="math" and id="2569896" role="math" .
Find the solutions to for the interval .
Solution:
The first step, as usual, is to sketch the graphs and id="2569908" role="math" on the same axes for the interval .
 Graphs of Trigonometric Functions- Graph showing solutions of tan(x)=2.3, Jordan Madge- StudySmarter Originals
We can see that there are two points of intersection and thus two solutions to . The first solution can be found by typing id="2569911" role="math" into our calculator. Doing so, we obtain id="2569912" role="math" This is clearly the first solution since it is between and degrees.
The graph of repeats itself periodically after degrees. Therefore, we can find the next solution by adding multiplies 180 to the initial solution. So, the second solution is at id="2569918" role="math" . Therefore, the two solutions to in the interval are id="2569915" role="math" and id="2569917" role="math" .
Solutions to any equations involving tan(x) can be found by adding multiples of 180 to the initial solution.
Find the solutions of for the interval .
Solution:
We cannot solve this equation in its current form. We first need to divide both sides by to get by itself. We obtain . Now, we can find the first solution to the equation by taking the inverse tan of both sides to get .
Now, since it is tan, we know that solutions can be found by adding or subtracting multiples of to the initial solution. Thus, the next solution will be at , however, this is out of the range. We can get another solution by subtracting from to get which is in the range. Subtracting a further will yield a solution out of the range, therefore the two solutions to in the interval are and .
Graphs of Trigonometric Functions - Key takeaways
- There are three graphs that we are interested in when studying the graphs of trigonometric functions: the graphs of sin(x), cos(x) and tan(x).
- The graphs of sin(x) and cos(x) have a maximum value of 1 and a minimum value of -1, the graph of tan(x) has a maximum and minimum of plus or minus infinity.
- The graph of cos(x) is just the graph of sin(x) shifted to the left by 90 degrees.
- The graphs of sin(x) and cos(x) have symmetry properties that enable us to find multiple solutions when solving equations.
- For equations involving tan(x), we can get each solution by adding multiples of 180 to each solution.


