Well, it is always practical to look at anything mathematical in a visual way. This allows us to look at trends and therefore examine the patterns involved. In this case, we shall represent quadratic equations in the form of a graph.
Quadratic Equations
Before we get into that, let us first recall the definition of a quadratic equation.
The standard form of a quadratic equation is defined by the expression y = ax2 + bx + c, where a ≠ 0.
A quadratic equation can be set as a function by y = f(x) ⇔ f(x) = ax2 + bx + c.
Here, ax2 is the quadratic term, bx is the linear term and c is the constant term.
As mentioned before, solving quadratic equations graphically is a neat trick that enables us to determine its solutions and notice any significant behaviours present within the given expression. The graph of a quadratic formula has a special name as defined below.
The graph of any quadratic equation is described by a parabola.
Throughout this topic, we shall look at techniques for graphing such equations. Before we begin, let us look at the components of a parabola.
Graph of a Quadratic Equation
Consider the graph of y = ax2 + bx + c as shown below.
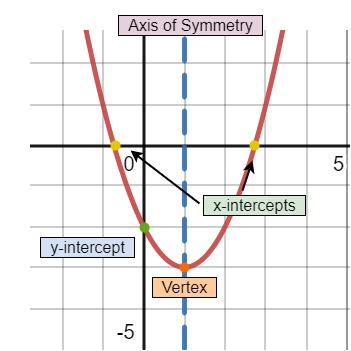
Components of a parabola, Aishah Amri - StudySmarter Originals
The axis of symmetry of a parabola is a vertical line that divides the parabola into two equal halves.
The vertex is the point at which the axis of symmetry intersects a parabola.
The y-intercept is found by plugging x = 0 into the quadratic equation as y = a(0)2 + b(0) + c = c.
The x-intercept is found by equating the quadratic equation to zero as ax2 + bx + c = 0.
The x-coordinate of the vertex is .
The y-coordinate of the vertex is .
Maximum and Minimum Values
The y-coordinate of the vertex can either be a maximum or minimum value. The vertex is known as the turning point of the parabola.
The turning point of a curve is a point at which the graph changes direction, i.e., changes from increasing to decreasing or decreasing to increasing.
The maximum value is the highest possible value of y the curve reaches.
The minimum value is the lowest possible value of y the curve achieves.
Considering the quadratic equation y = ax2 + bx + c, the parameter which tells us beforehand if the vertex of the respective parabola will be a maximum or minimum value is the sign of the coefficient of the leading term, i.e., the sign of a. The table below describes the graph for two cases a can take, that is, a > 0 and a < 0.
| Property | y = ax2 + bx + c, where a ≠ 0 |
| Value of coefficient a | a is positivea > 0 | a is negativea < 0 |
| Opening of Parabola | Opens upward | Opens downward |
| Turning Point of y | Minimum value | Maximum value |
| Range | All real numbers greater than or equal to the minimum | All real numbers less than or equal to the maximum |
| Graph Plot Example | 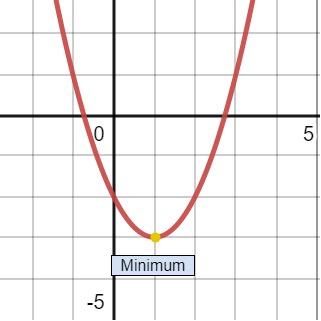
Minimum value, Aishah Amri - StudySmarter Originals | 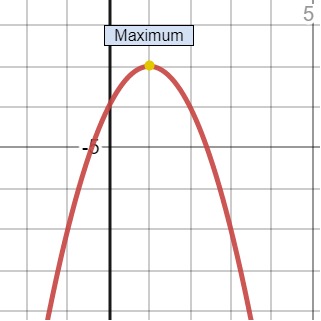
Maximum value, Aishah Amri - StudySmarter Originals |
Solutions of a Quadratic Equation
The solutions of a quadratic equation set to zero are also the roots or zeros of the respective quadratic function. These are the x-intercepts of the parabola and are solved by setting y to zero and solving for x as ax2 + bx + c = 0.
Considering the quadratic equation y = ax2 + bx + c, how would we know how many solutions it may have? This is where the discriminant comes into play! A quadratic equation can either have one real solution, two real solutions or no real solutions and is determined by the sign of the discriminant.
The Discriminant
The discriminant is defined by the expression D = b2 – 4ac.
The value of the discriminant can be used to determine the number and type of roots of a given quadratic equation. Given the quadratic equation ax2 + bx + c = 0, where a ≠ 0, there are three conditions for D that we must consider. This is explained in the table below along with their associated graphical representation for each of these cases.
| Number of Real Roots | Graph Plot |
Two Real Roots D > 0, D is a perfect square | 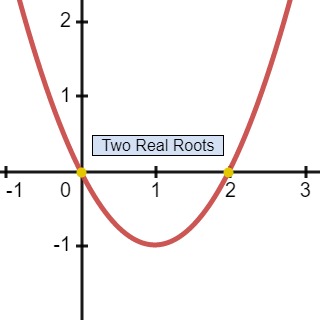 Two real roots, Aishah Amri - StudySmarter Originals |
One Real Root D = 0 | 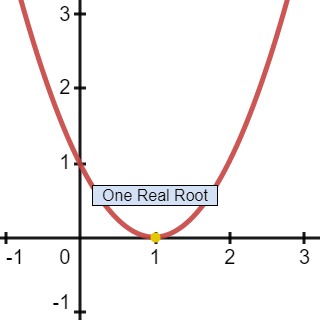 One real root, Aishah Amri - StudySmarter Originals |
No Real Roots D < 0 | 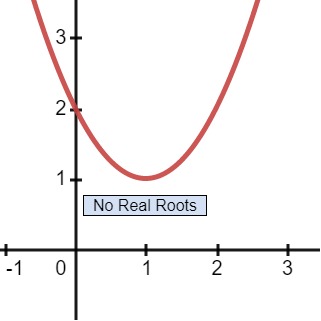 No real roots, Aishah Amri - StudySmarter Originals |
Solving Quadratic Equations by Graphing
For this technique of solving quadratic equations, we aim to graph such expressions by making a table of values. The steps for this method is explained below.
Set y = ax2 + bx + c;
Find the y-intercepts by plugging x = 0 into y;
Locate the axis of symmetry and vertex;
Plug-in several values for x into y and create a table of values for this calculated set of points;
Determine the x-intercepts. If the solutions cannot be found explicitly, we can estimate the solutions by identifying the integers between which the solutions are located;
Plot the graph.
In Step 5, we shall make use of the Location Principle to estimate the location of the solutions on a given quadratic equation. Below is an explanation of the Location Principle followed by three worked examples.
The Location Principle
Suppose y = f(x) represents a quadratic function and a and b are two real numbers such that f(a) < 0 and f(b) > 0. Then f has at least one real zero between a and b.
How does the Location Principle work?
The x-intercept of a graph crosses the x-axis at y = 0. This, in turn, changes the sign of the y-values that follow in the graph. Essentially, the Location Principle tells us that we are looking for a change in sign between two outputs of y given two inputs of x.
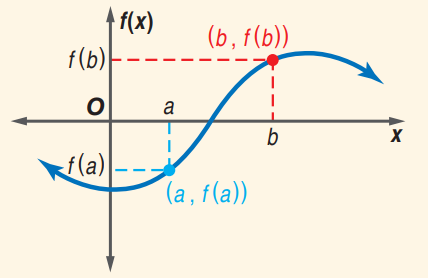
Location Principle, Algebra 2 - Glencoe McGraw-Hill (2008)
Consider the function f(x) = 2x2 – 4x – 3.
- Decide whether the function has a maximum or minimum value.
- Evaluate the maximum or minimum value of the function.
- State the domain and range of the function.
Solution
Here, a = 2, b = –4, and c = –3.
1. Since a > 0, the graph opens up and the function has a minimum value.
2. The minimum value of the function is the y-coordinate of the vertex.
The x-coordinate of the vertex is .
To find the y-coordinate of the vertex, we shall evaluate the function at x = 1.
Hence, the minimum value of the function is –5.
3. The domain is the set of all real numbers. The range is the set of all real numbers greater than or equal to the minimum value, f(x) ≥ –5. In set notation, [–5, +∞ [.
The graph is shown below.
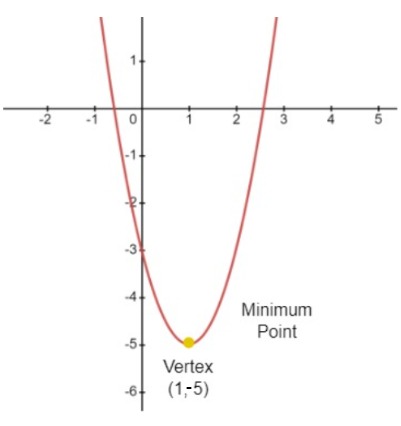
Example 1, Aishah Amri - StudySmarter Originals
Consider the function f(x) = x
2 – 6x + 3.
- Determine the y-intercept, the equation of the axis of symmetry, and the x-coordinate of the vertex.
- Create a table of values that includes the vertex.
- Graph the function based on the results from Questions 1 and 2.
Solution
Here, a = 1, b = –6 and c = 3.
1. To find the y-intercept we shall evaluate f at x = 0. In doing so we obtain, f(0) = c = 3. Thus the y-intercept is (0, 3). The equation of the axis of symmetry is found by using the formula
Therefore, the equation of the axis of symmetry is x = 3. It follows that the x-coordinate of the vertex is 3.
2. We shall now make our table of values. To do this, choose some values for x that are less than 3 and some that are greater than 3. This ensures that the points on each side of the axis of symmetry are graphed.
Let us apply the Location Principle to this example. Looking at the table above, there happens to be a change in sign between x = 0 and x = 1. This indicates that there is one real zero between these two values of x. Similarly, we observe a change in sign between x = 5 and x = 6 which again tells us that one real zero must exist between this pair of x values.
3. The graph is shown below.
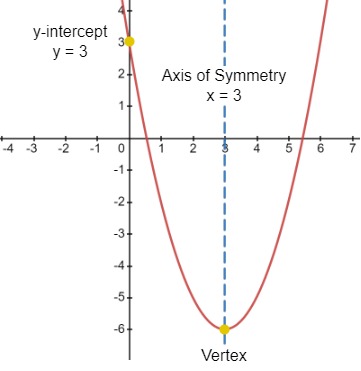
Example 2, Aishah Amri - StudySmarter Originals
Solve the quadratic equation x2 + 5x – 2 = 0 by graphing. If exact solutions cannot be found, state the consecutive integers between which the solutions are located.
Solution
Let f(x) = x2 + 5x – 2.
We must now make a table of values for a domain x. We need to make a guess of the range of x-values we want to apply the Location Principle on. We shall choose the integer values between x = –6 and x = 2.
By the Location Principle, notice that the x-intercepts of the graph suggest that one solution is between –6 and –5, and the other is between 0 and 1.
| x | –6 | –5 | –4 | –3 | –2 | –1 | 0 | 1 | 2 |
| f(x) | 4 | –2 | –6 | –8 | –8 | –6 | –2 | 4 | 12 |
Solving Quadratic Equations by Factoring
Intercept Form of a Quadratic Equation
The intercept form of a quadratic equation is y = a(x – p)(x – q) where p and q represent the roots of a given quadratic equation. In other words, p and q are the x-intercepts of the graph corresponding to the function.
IMPORTANT NOTE
The general form of the intercept form is y = a(bx + c)(dx + e) where bx + c = 0 and dx + e = 0.
In order to express the intercept form of a quadratic equation into the standard form of a quadratic equation, we can use the FOIL method.
FOIL Method
The FOIL method uses the Distributive Property to multiply binomials. Essentially, we are expanding a given intercept form to obtain the typical expression for a quadratic equation. The FOIL method states that the product of two binomials is the sum of the products of F the first terms, O the outer terms, I the inner terms, and L the last terms.
A binomial is an expression consisting of two terms.
Express a quadratic equation with and 4 as its roots. Write the equation in standard form.
Solution
The intercept form of a quadratic equation is given by (x – p)(x – q) = 0 where p and q represent the roots of the expression. As there is no information on the coefficient of x2 in this question, this infers that a = 1. Here, we are given
Substituting this into the form above we obtain
We now want to write this equation in the standard form of a quadratic equation. To do this, we must expand the right-hand side of the expression using the FOIL method.
Multiplying the entire equation by 3, we finally obtain
Factoring Techniques for Quadratic Equations
We can factor quadratic equations by identifying certain patterns in a given expression. Factoring is a method where we simplify the standard form of a quadratic equation into the intercept form. This will allow us to locate the roots of the expression and plot the x-intercepts for the corresponding graph. There are four ways in which we can factor quadratic equations. This is described in the table below.
Factoring Technique | General Case |
Greatest Common Factor (GCF) | |
Difference of Two Squares | |
Perfect Square Trinomials | |
General Trinomials | |
It is helpful to note that the FOIL method can also be used to factor a quadratic equation into the product of two binomials. Notice that the product of the coefficient of x2 and the constant term is abcd. Similarly, multiplying the two terms in the coefficient of x also yields abcd. Once we have factored our given quadratic equation, we can solve it by using the Zero Product Property.
Zero Product Property
For any real numbers a and b, if ab = 0, then either a = 0, b = 0, or both a and b equal zero.
In terms of the intercept form y = a(x – p)(x – q), setting y = 0 yields x – p = 0 and x – q = 0. Solving this, we obtain x = p, x = q. The same concept applies to the generalized form as well where y = a(bx + c)(dx + e). Here, setting y = 0 yields bx + c = 0 and dx + e = 0. Therefore, .
Here are some worked examples that demonstrate this concept.
Factor the quadratic equation 3x2 = 9x and graph the respective function.
Solution
We begin by rearranging the equation to the standard form of a quadratic equation
Notice that we can factor out 3x from the expression above as
By the Zero Product Property, the roots of this function is
Since the coefficient of x2 is a = 3 > 0, the parabola opens upward. The graph is shown below.
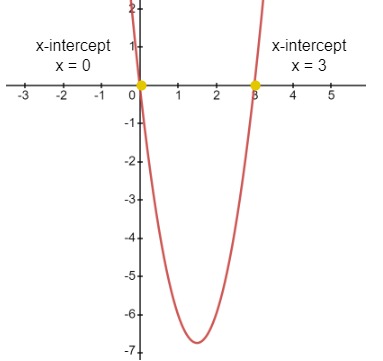
Example 3, Aishah Amri - StudySmarter Originals
Factor the quadratic equation 6x2 = 1 – x and graph the respective function.
Solution
We begin by rearranging the equation to the standard form of a quadratic equation
This is a general trinomial in which we can factorize by (ax + b)(cx + d). Note that the coefficient 6 can be factorized as while the constant -1 can be factorized as .
Remember that you have to test all possible pairs and positions for these two products. Using trial and error, we can factorize this as
By the Zero Product Property, the roots of this function are
Since the coefficient of x2 is a = 6 > 0, the parabola opens upward. The graph is shown below.
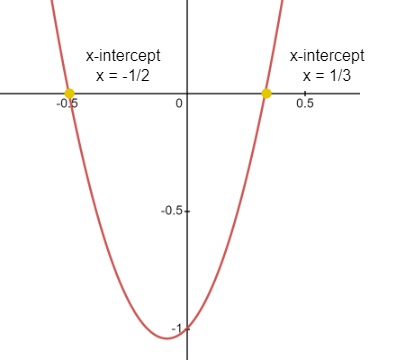
Example 4, Aishah Amri - StudySmarter Originals
Factor the quadratic equation x2 – 25 = 0 and graph the respective function.
Solution
Notice that .
Thus, the equation takes the form of the difference of two squares. Therefore, we can factorize this as
By the Zero Product Property, the roots of this function are
Since the coefficient of x2 is a = 1 > 0, the parabola opens upward. The graph is shown below.
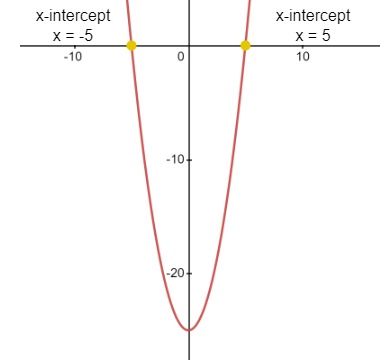
Example 5, Aishah Amri - StudySmarter Originals
The Square Root Property
We can also solve quadratic equations by using the Square Root Property. This technique can only be used to solve quadratic equations where the quadratic expression is a perfect square.
A perfect square is an integer that is the square of an integer. In particular, it is the product of some integer with itself.
The imaginary number i is derived by i2 = –1. Thus the square root of –1 is i.
The Square Root Property
For any real number n, if x2 = n, then
Let us look at some worked examples.
Solve the quadratic equation x2 – 12x + 36 = 25 using the Square Root Property.
Solution
Notice that the left-hand side of this expression takes the form of a perfect square trinomial. Factorizing this, we obtain
Now using the Square Root Property to solve this, we obtain
Thus, the two roots are x = 1 and x = 11. The graph is shown below.
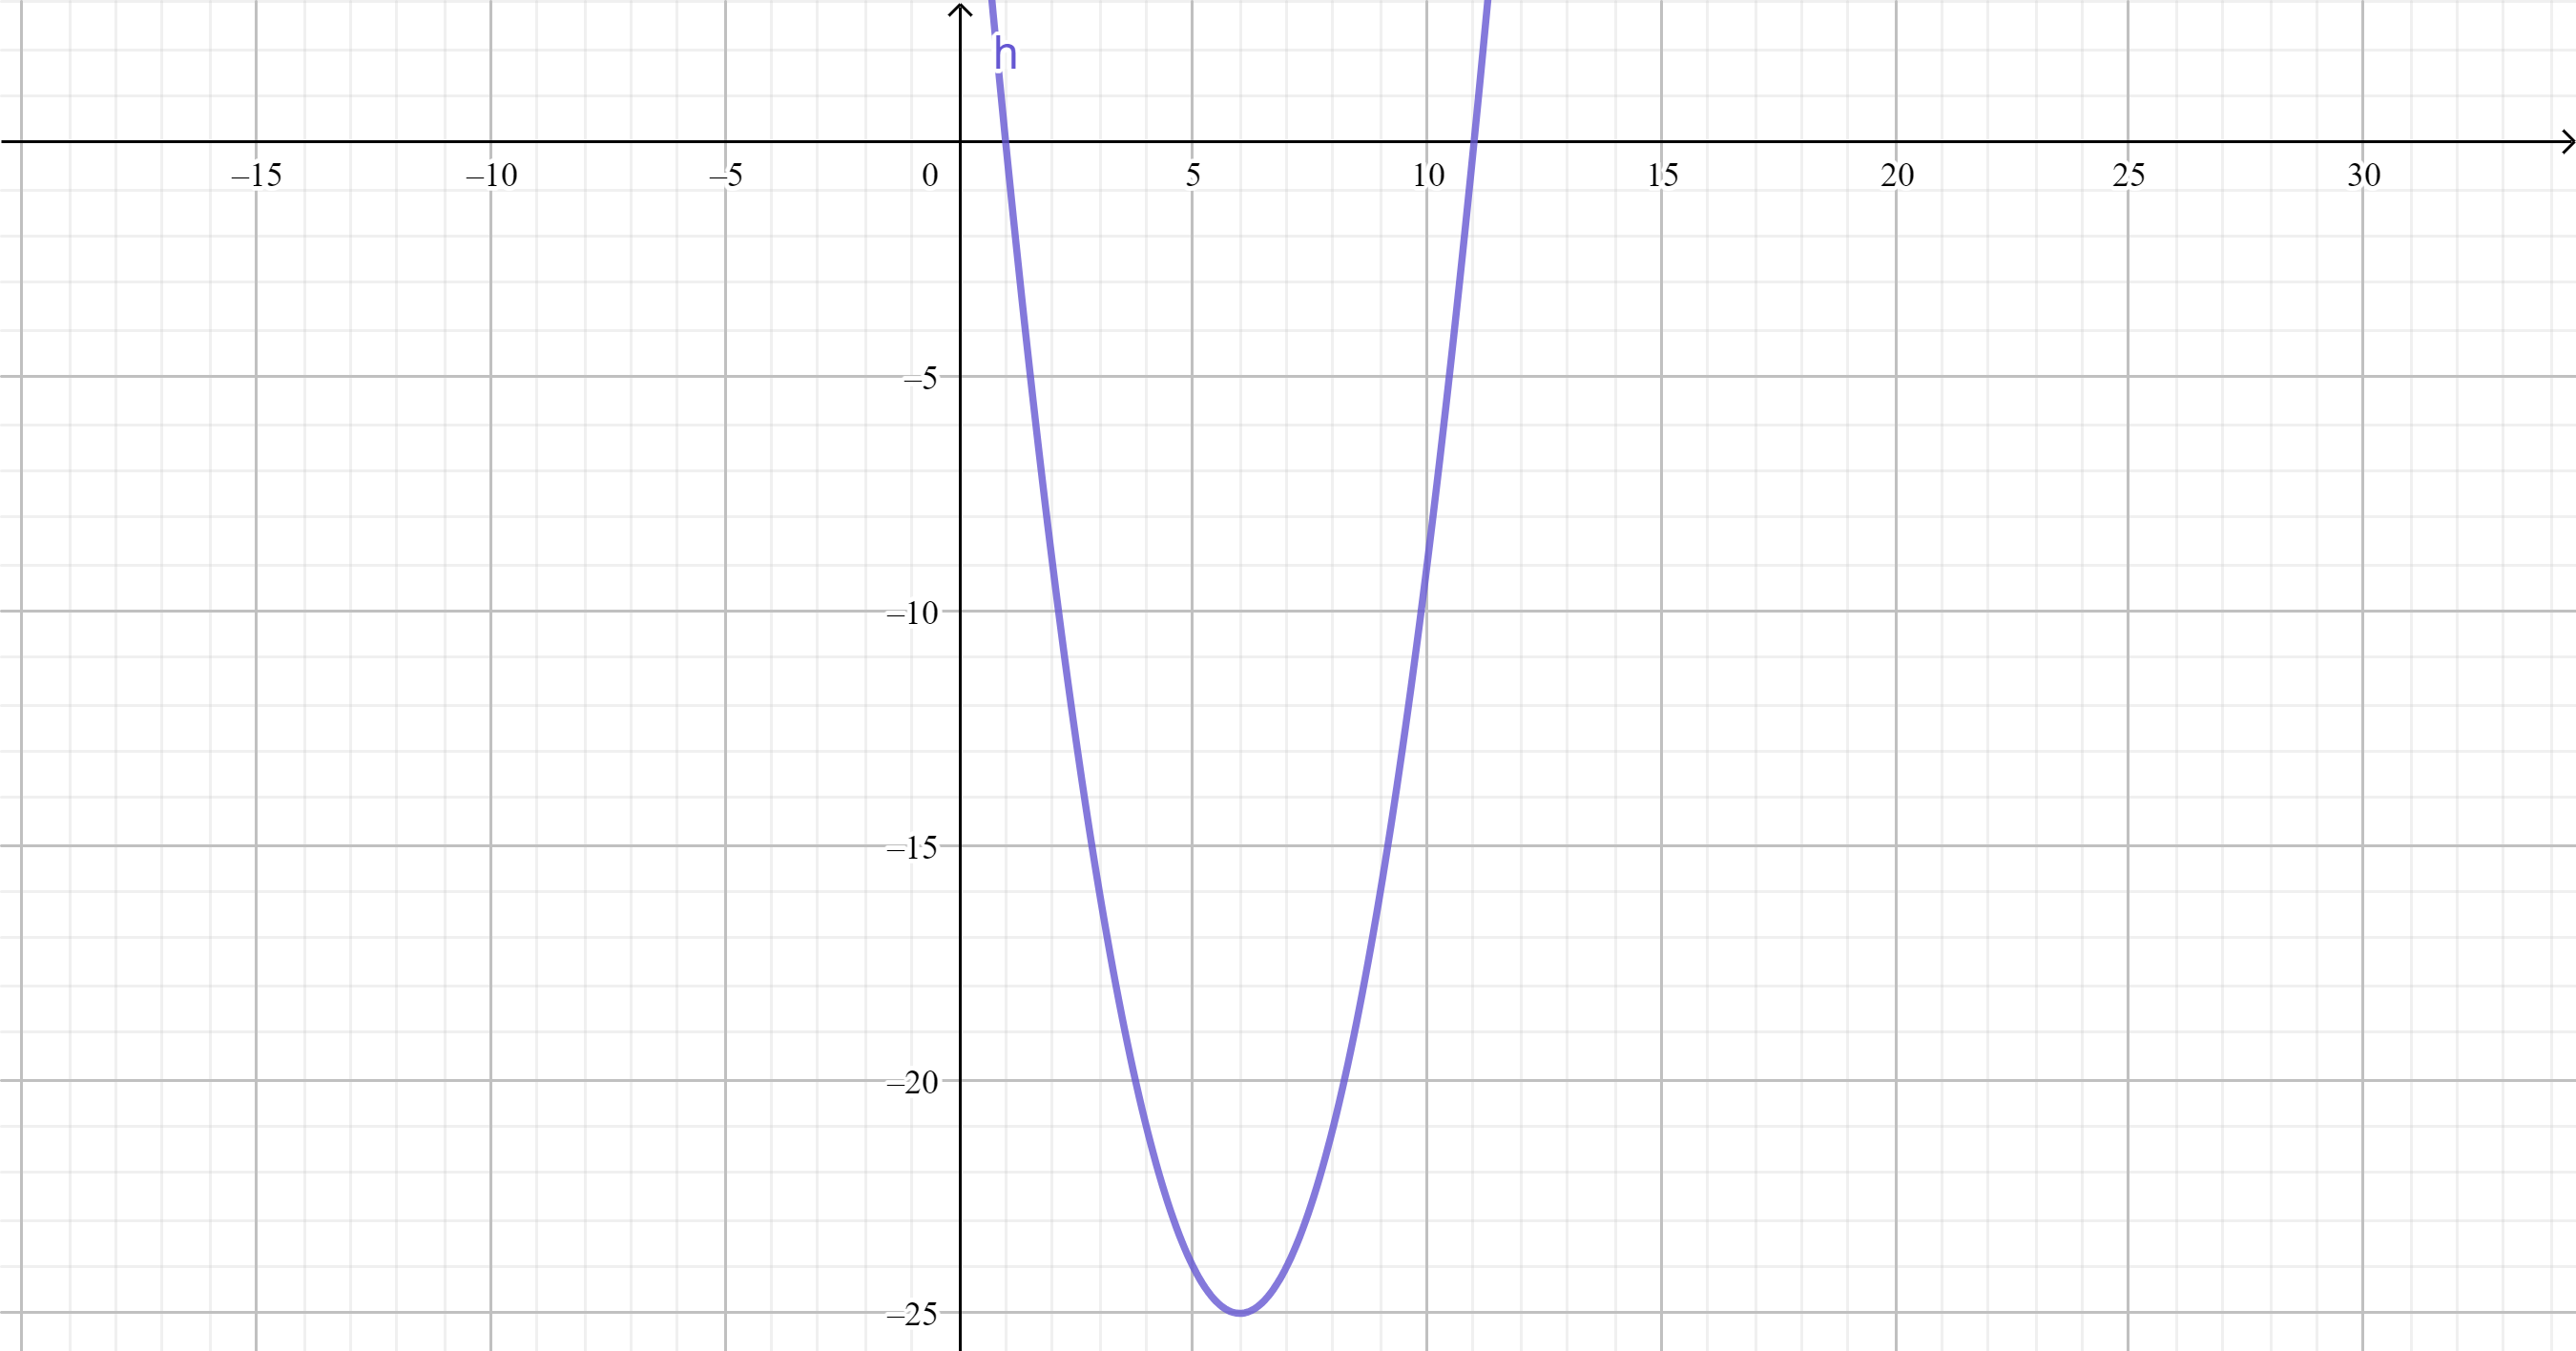
Example 6 (1), Aishah Amri - StudySmarter Originals
Zooming into this graph, we see that the roots are indeed x = 1 and x = 11.
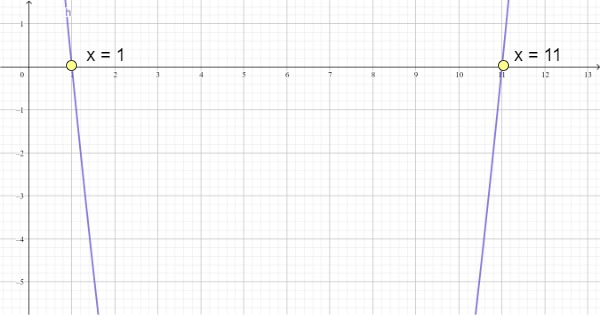
Example 6 (2), Aishah Amri - StudySmarter Originals
Solve the quadratic equation x2 + 8x + 16 = 20 using the Square Root Property.
Solution
Notice that the left-hand side of this expression takes the form of a perfect square trinomial. Factorizing this, we obtain
Now using the Square Root Property to solve this, we obtain
Thus, the two roots are
A rough sketch of this graph is shown below.
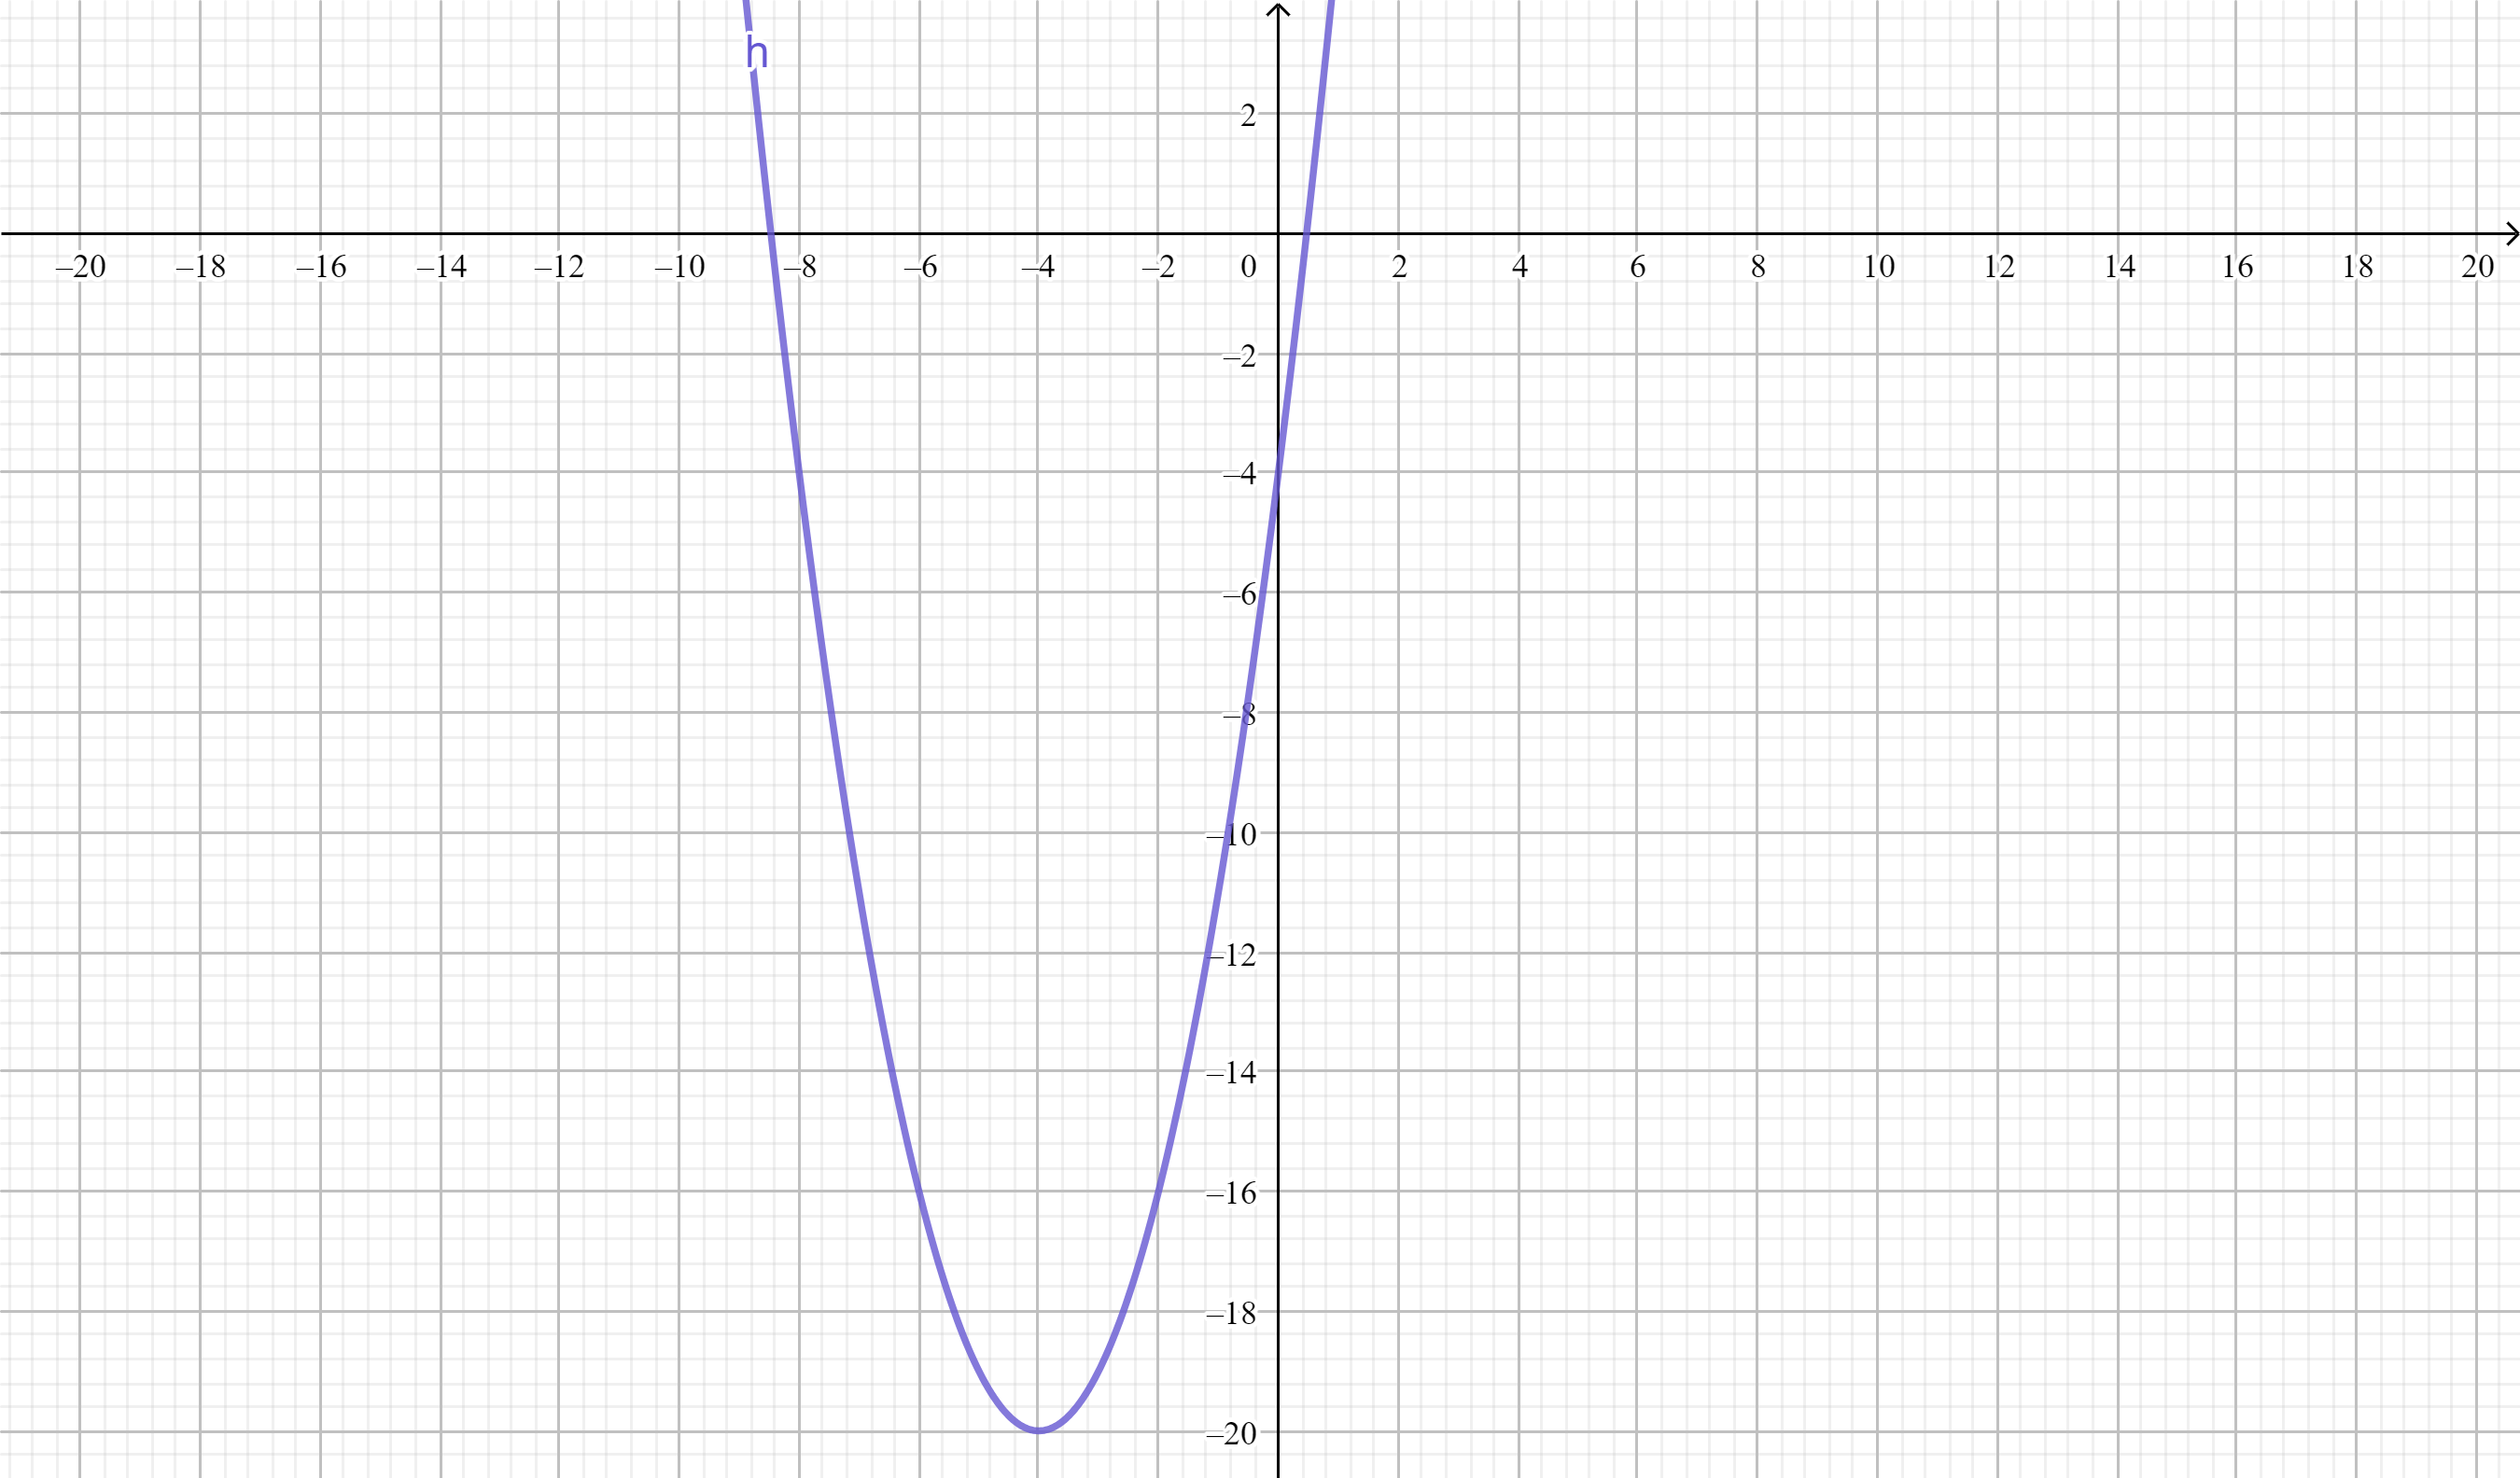
Example 7 (1), Aishah Amri - StudySmarter Originals
Zooming into this graph, we see that the roots are approximately x ≈ -8,47 and x ≈ 0.47.
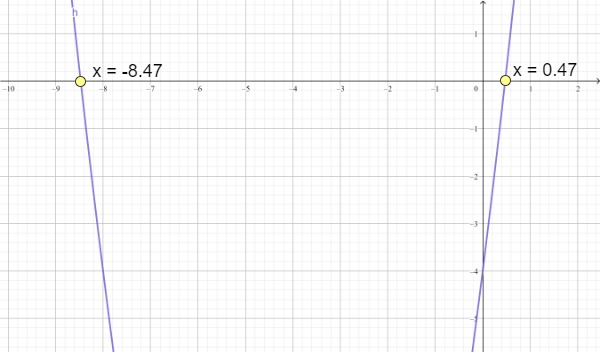
Example 7 (2), Aishah Amri - StudySmarter Originals
Completing the Square
In most cases, quadratic equations do not come as perfect squares. However, we can manipulate the expression to take the form of a perfect square by using the Completing the Square method. The steps for this technique is described below.
1. Set the quadratic equation as ax2 + bx + c = 0;
2. Divide the equation by as
;
3. Bring the constant to the right-hand side of the expression as
;
4. Half the coefficient of x and square the result. Add this value to each side of the equation as
;
5. Complete the square on the left-hand side and evaluate the constant on the right-hand side as
;
6. We can now use the Square Root Property to solve this quadratic equation as
;
7. Thus, the solutions for the given quadratic equation are
.
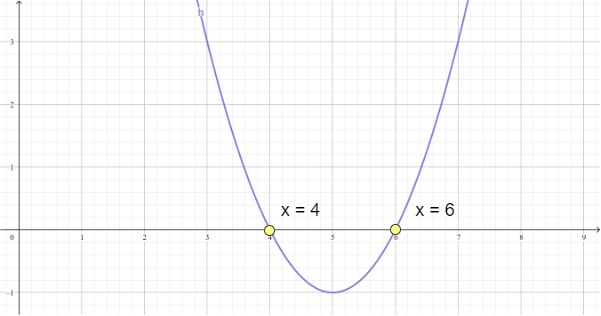
Solve the quadratic equation x2 – 10x + 24 = 0 by completing the square.
Solution
Subtract 24 from both sides of the equation as
To complete the square of this expression, we must find the missing values of
Since
we shall add 25 to each side to balance the equation
Rewrite the left-hand side as a perfect square by factoring
We can now use the Square Root Property
Thus, the two solutions are x = 4 and x = 6. The graph is shown below.
Example 8, Aishah Amri - StudySmarter Originals
Solve the quadratic equation 3x2 + 10x – 8 = 0 by completing the square.
Solution
Divide the equation by the coefficient 3
Add on both sides
To complete the square of this expression, we must find the missing values of
Since
we shall add to each side to balance the equation
Rewrite the left-hand side as a perfect square by factoring
We can now use the Square Root Property
Thus, the two solutions are . The graph is displayed below.
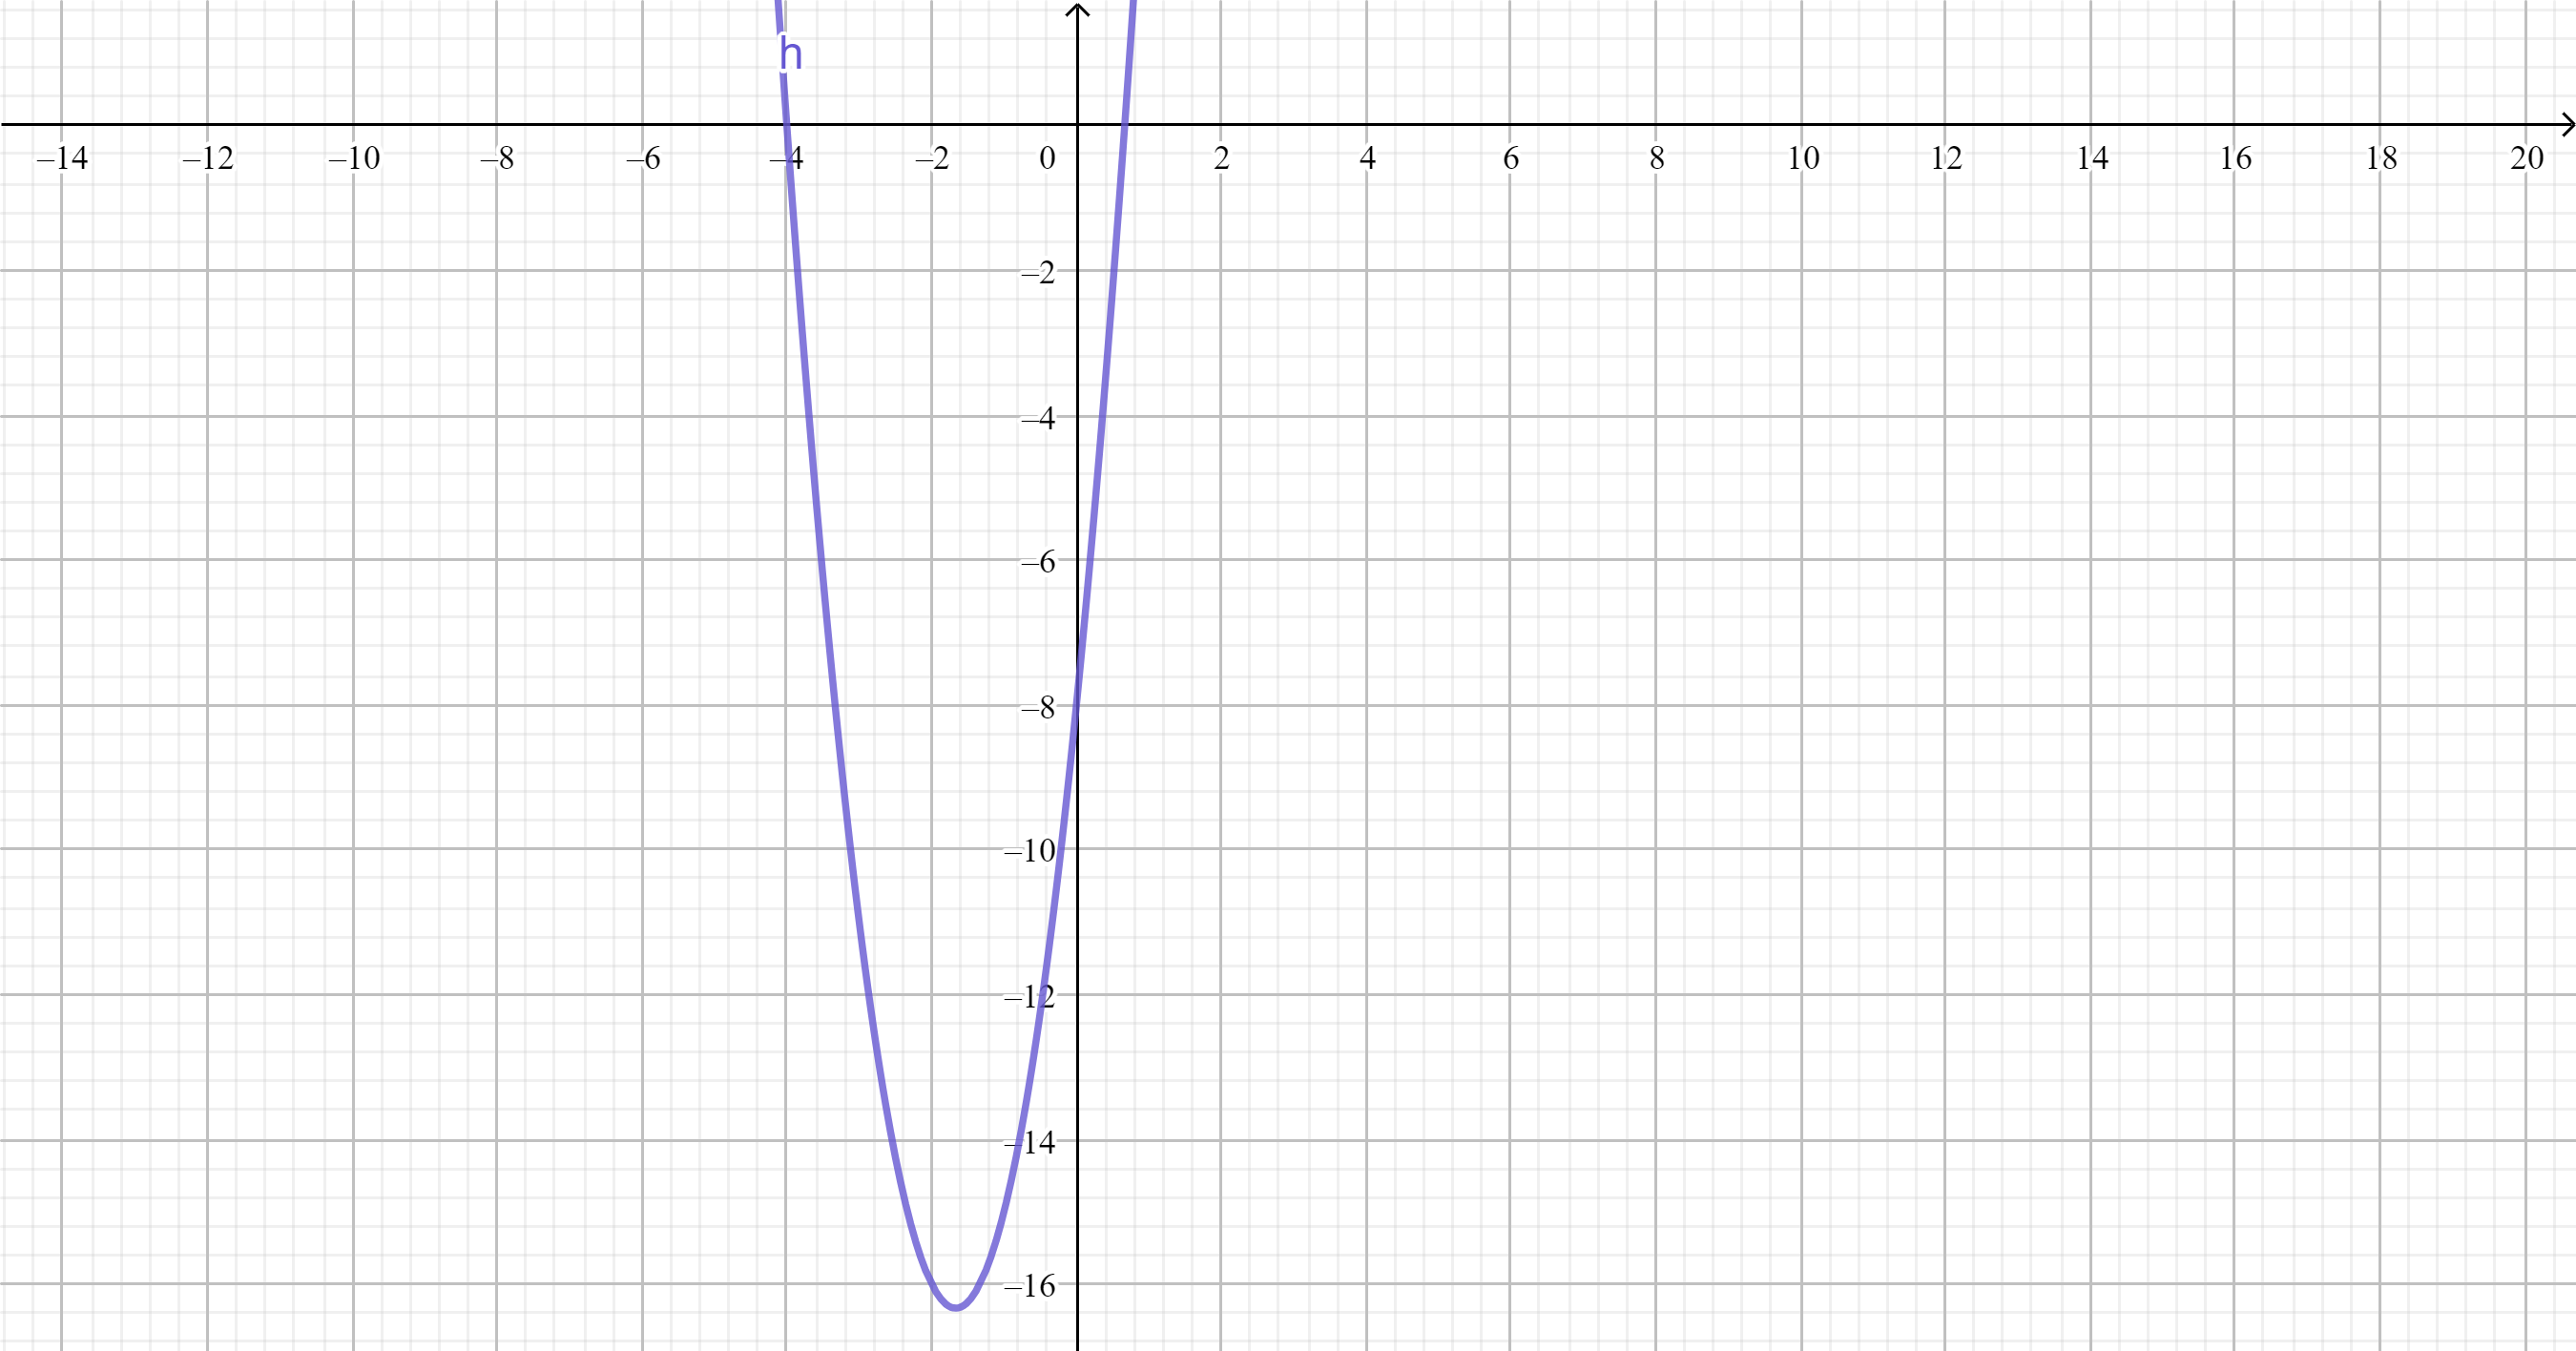
Example 9 (1), Aishah Amri - StudySmarter Originals
Zooming into this graph, we see that the roots are true as required.
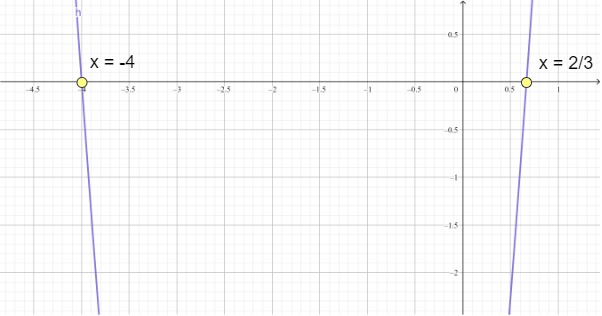
Example 9 (2), Aishah Amri - StudySmarter Originals
The Quadratic Formula
Another way to solve quadratic equations is by using the Quadratic Formula. This is a very helpful tool when dealing with quadratic equations that produce irrational roots. However, we can indeed use this formula to solve every form of a quadratic equation. That means we can use this formula to find rational solutions as well!
Quadratic Formula
The roots of a quadratic equation of the form ax2 + bx + c = 0, where a ≠ 0, can be found by the formula
.
Identify the number and type of roots for the quadratic equation 3x2 + 5x + 1 = 0 . Determine the roots of this expression using the Quadratic Formula.
Solution
Here,
We begin by finding the value of the discriminant as
Since D > 0, we must have two real roots. Also, note that D is not a perfect square so the roots for this quadratic equation must be irrational. We shall now use the Quadratic Formula to determine these roots.
Thus, the two roots are
The graph is shown below.
Example 10, Aishah Amri - StudySmarter Originals
Determine the number and type of roots for the quadratic equation x2 – 6x + 10 = 0 . Determine the roots of this expression using the Quadratic Formula.
Solution
Here,
We begin by finding the value of the discriminant as
Since D < 0, we must have two complex conjugate roots. We shall now use the Quadratic Formula to determine these roots.
Thus, the two complex conjugate roots are
The graph is shown below.
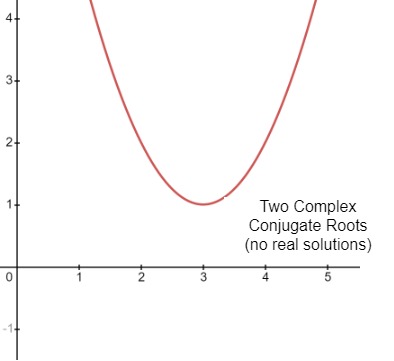
Example 11, Aishah Amri - StudySmarter Originals
Analyzing Graphs of Quadratic Equations
In this section, we shall be introduced to the vertex form of a quadratic equation. Here, we shall refer to the standard quadratic equation, that is, y = x2 and observe how manipulating certain coefficients can change the shape of this simple graph. Let us begin with the following definition.
The vertex form of a quadratic equation is described by the expression y = a(x – h)2 + k where (h, k) is the vertex of the parabola and x = h is the axis of symmetry.
Translation
The vertex form is a clever way to express quadratic equations so that we can translate the graph accordingly based on the standard quadratic equation. First, let us define what a translation is.
A translation slides a figure without changing its shape or size.
We can apply this concept in graphing quadratic equations by altering the coefficients or constants in a given expression. The graph of the basic quadratic function is f(x) = x2. This is shown below.
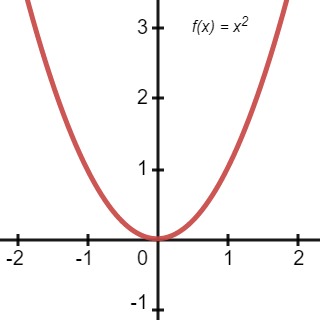
Standard quadratic graph, Aishah Amri - StudySmarter Originals
The vertex here is the origin, (0, 0) and the axis of symmetry is x = 0. Say we are given a quadratic equation in vertex form, y = a(x – h)2 + k. There are three ways in which we can transform this graph. This is illustrated in the table below.
| Vertex Form | Change in Value | Plot of Graph |
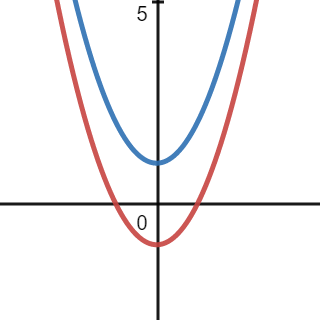
| y = a(x - h)2 + k | - If a is large, the graph becomes steeper (red line)
- If a is small, the graph becomes flatter (blue line)
- If a is negative, the graph becomes inverted (green line)
| 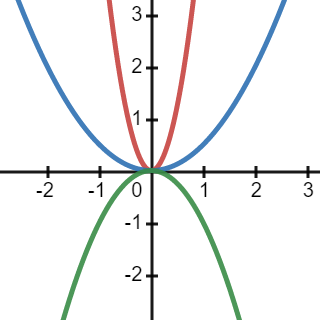
Varying a, Aishah Amri - StudySmarter Originals |
| Varying a alters the function in the y-direction, (the coefficient a affects the steepness of the graph) |
| y = a(x - h)2 + k | - If h is negative, the graph shifts h units to the left of the x-axis (red line)
- If h is positive, the graph shifts h units to the right of the x-axis (blue line)
| 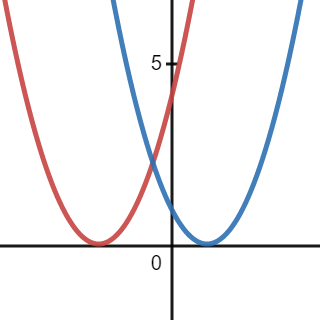
Varying h, Aishah Amri - StudySmarter Originals |
| Varying h changes the function along the x-axis by h units |
| y = a(x - h)2 + k | - If k is negative, the graph moves down k units in the y-axis (red line)
- If k is positive, the graph moves up k units in the y-axis (blue line)
| 
Varying k, Aishah Amri - StudySmarter Originals |
| Varying k translates the function up or down the y-axis by k units |
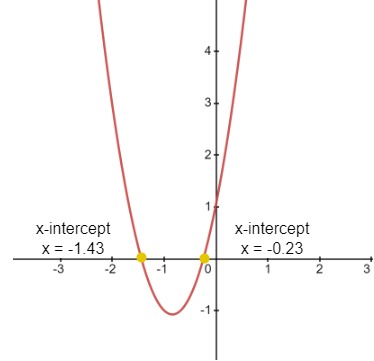
Express the equation y = x2 + 4x + 6 in vertex form and plot the graph of the function.
Solution
Notice that y = x2 + 4x + 6 is not a perfect square. We begin by completing the square of this expression.
To find the missing values, we add and balance the equation by subtracting 4 as
Now writing this as a perfect square, we obtain
Since h = –2 and k = 2, the vertex is at (–2, 2). The axis of symmetry is x = –2. Since a = 1, the graph opens up and has the same shape as the graph of y = x2. Furthermore, the graph is translated 2 units left and 2 units up.
The graph is shown below.
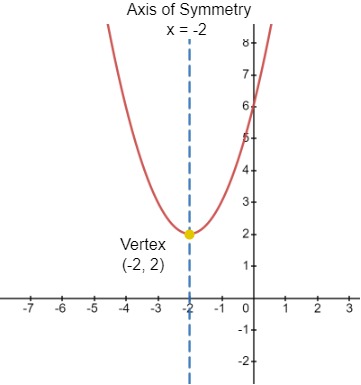
Example 12, Aishah Amri - StudySmarter Originals
Write the equation y = –2x2 – 12x + 17 in vertex form and plot the graph of the function.
Solution
Notice that y = –2x2 – 12x + 17 is not a perfect square. We begin by factoring the first two terms of the right-hand side as
Next, we shall complete the square of this expression.
To find the missing values, we add and balance the equation by subtracting –2(9) as
Now writing this as a perfect square, we obtain
The vertex is at (–3, 35), and the axis of symmetry is x = –3. Since a = –2, the graph opens downward and is narrower than the graph of y = x2. Additionally, the graph is translated 1 unit right and 2 units up.
The graph is shown below.
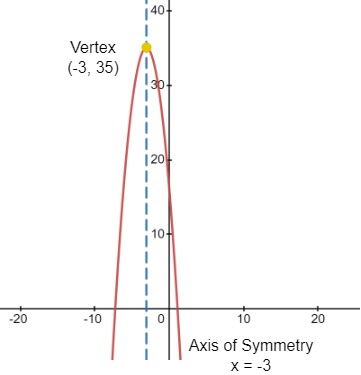
Example 13, Aishah Amri - StudySmarter Originals
Graph and Solve Quadratic Equations - Key takeaways
- The standard form of a quadratic equation is ax2 + bx + c = 0 where a ≠ 0.
- The y-intercept is found by plugging x = 0 into the quadratic function.
- The x-intercept is found by equating the quadratic function to zero, f(x) = 0
- If a > 0, the graph has a minimum point and the parabola opens upward.
- If a < 0, the graph has a maximum point and the parabola opens downward.
- The x-coordinate of the vertex is
- The y-coordinate of the vertex is
- There are four ways to factor quadratic equations
- Greatest Common Factor (GCF)
- Difference of Two Squares
- Perfect Square Trinomials
- General Trinomials
- We use the Zero Product Property to solve factorized quadratic equations.
- The Quadratic Formula is used to find the roots of a quadratic equation and is given by
- The discriminant is used to determine the number and type of roots of a given quadratic equation and is given by D = b2– 4ac.
- If D > 0 then there are two real roots
- If D = 0 then there is only one root
- If D < 0 then there are two complex conjugate roots
- The intercept form of a quadratic equation is y = a(x – p)(x – q) where p and q are roots of the expression.
- The Square Root Property states that for any real number n, if x2 = n, then
- Completing the Square method is used to solve quadratic equations by writing the equation in the form of a perfect square.
- The vertex form of a quadratic equation is described by the expression y = a(x – h)2 + k where (h, k) is the vertex of the expression.
- We can use translations to graph a quadratic function.
- For the vertex form y = a(x – h)2+ k
- Varying a alters the function in the y-direction
- Varying h changes the function along the x-axis by h units
- Varying k translates the function up or down the y-axis by k units


