Quadratic Inequalities
Before we begin, let us define a quadratic inequality.
A quadratic inequality is a polynomial of second degree that uses an inequality sign instead of an equal sign.
There are four types of quadratic inequalities (in two variables) we shall discuss in this topic, namely
A quadratic inequality in one variable only has one unknown in the quadratic expression and can be represented in a single axis or number line – this is usually the x-axis. The graph of a quadratic inequality in two variables is made up of all ordered pairs (x, y) that are solutions to the given quadratic inequality.
A quadratic inequality in two variables describes a region in the Cartesian plane with a parabola (curve) as the boundary. Here, we consider both the x and y-axis.
The standard forms of quadratic inequalities (in one variable) are:
Solving Quadratic Inequalities In One Variable
Solving quadratic inequalities in one variable are essentially similar to solving quadratic equations. The only difference here is that we are interested in finding the interval of real numbers for which the inequality is satisfied, rather than equating the given expression to zero.
In this section, we shall use basic factorization methods to solve such quadratic inequalities. The steps for this technique is explained below.
Step 1: Write the quadratic inequality in general form, i.e., with ax2 + bx + c, where a ≠ 0, on one side of the inequality;
Step 2: Completely factorize the quadratic expression of the inequality;
Step 3: Identify the roots of the inequality, through a corresponding equation;
Step 4: Determine the behaviour of the quadratic inequality:
If the inequality is of the form when then, ;
If the inequality is of the form when then, .
Step 5: Express the solution in inequality notation or interval notation
Cases a) and b) follow similarly for inequalities < and > respectively.
Graphing Quadratic Inequalities In One Variable
To evaluate quadratic inequalities in one variable, we can also make use of the graph of the given polynomial. The table below describes the graphical representation for each case of inequality the quadratic may have.
The shaded region in the plots below represents the correct solution to the given quadratic inequality
| Case | a > 0 | a < 0 |
| 1 | ax2 + bx + c < 0 |
Method:- Graph y = ax2 + bx + c
- Since y is negative, determine the x-values for which the graph lies below the x-axis
- For >, do not include the x-intercepts in the solution. This is indicated by open circles (as seen in the graph)
- Write the solution in terms of its interval notation (as shown below each graph)
| 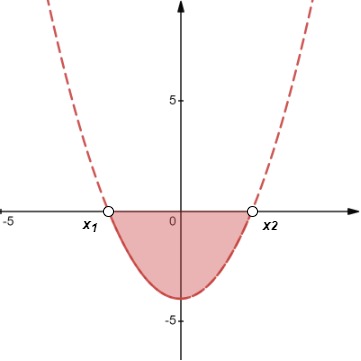
Inequality graph Case 1 (a), Aishah Amri - StudySmarter Originals Solution: x1 < x < x2 | 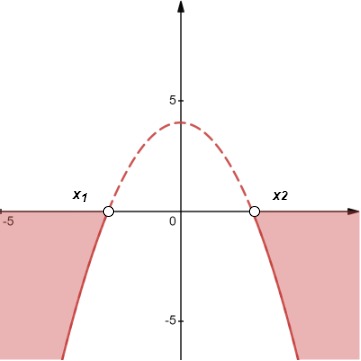
Inequality graph Case 1 (b), Aishah Amri - StudySmarter Originals Solution:x < x1 or x > x2 |
| 2 | ax2 + bx + c ≥ 0 |
Method: - Graph y = ax2 + bx + c
- Since y is positive, determine the x-values for which the graph lies above the x-axis
- For ≤, include the x-intercepts in the solution. This is indicated by closed circles (as seen in the graph)
- Write the solution in terms of its interval notation (as shown below each graph)
| 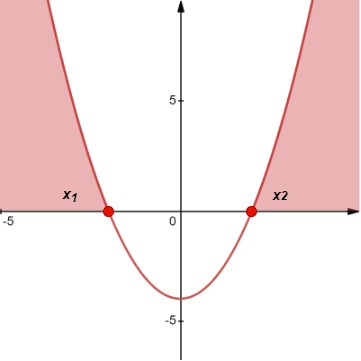
Inequality graph Case 2 (a), Aishah Amri - StudySmarter Originals Solution:x ≤ x1 or x ≥ x2 | 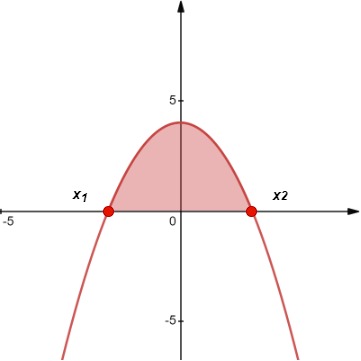
Inequality graph Case 2 (b), Aishah Amri - StudySmarter Originals Solution: x1 ≤ x ≤ x2 |
Solve the inequality .
Solution
Step 1: Bringing –6 to the left-hand side of the inequality, we obtain
Factorizing this quadratic inequality yields
Step 2: We now need to find the roots of inequality. Our first instinct here may be to use the Zero Product Property. However, note that the Zero Product Property is used for equations, not inequalities. Instead, we need to solve for the x-intercepts by switching the inequality to an equation and then adjusting the inequality sign for the situation at hand in terms of the found x-intercepts. This is shown below.
Step 3: From the table, we find that this inequality obeys Case 2 with a > 0. Since y is positive, we must choose the values of x for which the curve is above the x-axis.
Step 4: Now, writing the solution in interval notation, we obtain
The graph is shown below.
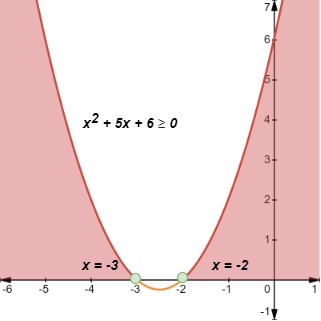
Example 1, Aishah Amri - StudySmarter Originals
Solve the inequality .
Solution
Step 1: Bringing 19x and –6 to the left-hand side of the inequality, we obtain
Factorizing this quadratic inequality yields
Step 2: As with the previous example, we shall treat our inequality above as an equation to determine its roots as below.
Step 3: Referring again to our table, we see that this inequality obeys Case 1 with a > 0. Since y is negative, we must choose the values of x for which the curve is below the x-axis.
Step 4: Thus, writing the solution in its corresponding interval notation form, we have
The graph is shown below.
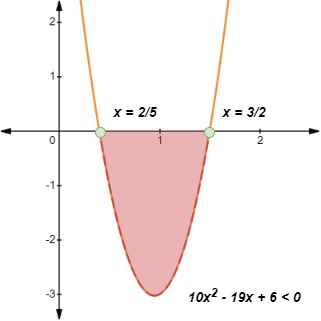
Example 2, Aishah Amri - StudySmarter Originals
Graphing Quadratic Inequalities In Two Variables
Graphing quadratic inequalities (in two variables) uses the same principles as graphing linear inequalities. Below is a detailed method of tackling such problems.
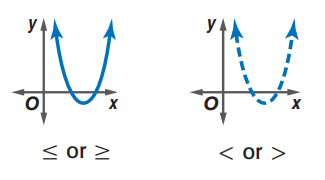
Step 1: Sketch the quadratic function y = ax2 + bx + c. Determine the nature of the parabola based on the given inequality.
Draw a dashed parabola for inequalities with < or > to describe that the points on the parabola are not solutions.
Draw a solid parabola for inequalities with ≤ or ≥ to describe that the points on the parabola are solutions.
Glencoe McGraw-Hill, Algebra 2 (2008)
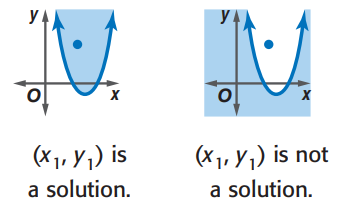
Step 2: Take a point (x1, y1) inside the parabola. Test to see if this point is a solution to the inequality.
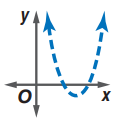
Glencoe McGraw-Hill, Algebra 2 (2008)
Step 3: Shade the correct region that satisfies the inequality.
If (x1, y1) is a solution, shade the region inside the parabola.
If (x1, y1) is not a solution, shade the region outside the parabola.
Glencoe McGraw-Hill, Algebra 2 (2008)
Below are several worked examples to demonstrate this technique.
Graph the quadratic inequality .
Solution
Step 1: We begin by graphing the polynomial
The coefficient of x2 is negative, so the curve opens down. Factorizing this expression, we obtain
Equating this to zero, we have roots at .
Since the inequality is >, our curve must be a dashed line. The graph is shown below.
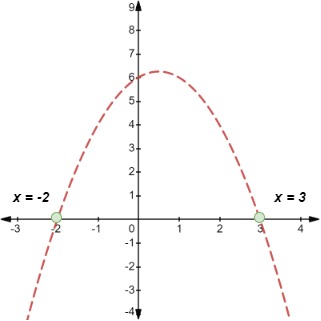
Example 3 (1), Aishah Amri - StudySmarter Originals
Step 2: Let us now test a point inside the parabola, say (1, 2). Plugging x = 1 and y = 2 into our quadratic inequality, we find that
Step 3: 2 is not more than 6, so the inequality fails. Thus, (1, 2) is not a solution to the inequality and so we must shade the region outside the parabola as shown below.
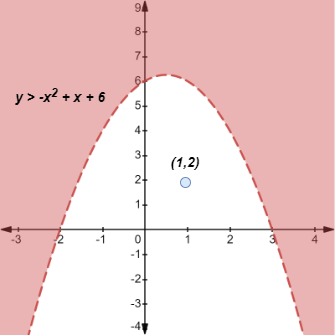
Example 3 (2), Aishah Amri - StudySmarter Originals
Now if we consider the quadratic inequality in one variable, we obtain
Hence, y is negative and we must choose the values of x for which the curve is below the x-axis. The final graph is shown below.
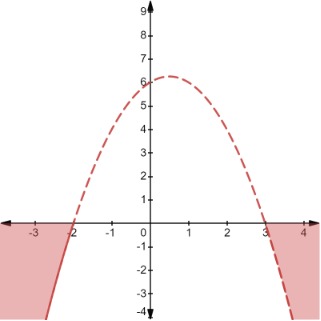
Example 3 (3), Aishah Amri - StudySmarter Originals
Using the Quadratic Formula to Solve Quadratic Inequalities
Just like solving quadratic equations that cannot be factorized using standard factorization techniques, we can apply the Quadratic Formula to evaluate quadratic inequalities.
Graph the quadratic inequality .
Solution
Step 1: As before, we shall attempt to first graph the polynomial .
The coefficient of x2 is positive, so the curve opens up. Notice that we cannot factorize this expression using standard factoring methods. Hence, we shall apply the Quadratic Formula to determine the roots.
Given that
we evaluate
Thus, we obtain two irrational roots
Since the inequality is ≤, our curve must be a solid line. The graph is shown below.
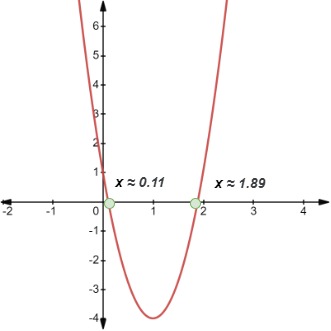
Example 4 (1), Aishah Amri - StudySmarter Originals
Step 2: Let us now check a point inside the parabola, say (1, –1). Plugging x = 1 and y = –1 into out inequality, we find that
Step 3: –1 is not less than or equal to –4, so the inequality fails. Thus, (1, –1) is not a solution to the inequality and so we must shade the region outside the parabola as below.
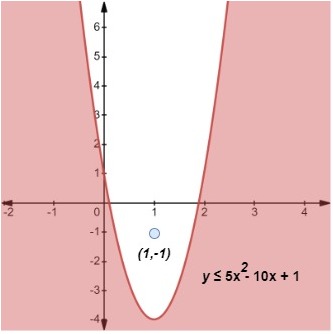
Example 4 (2), Aishah Amri - StudySmarter Originals
Now if we consider the quadratic inequality in one variable, we obtain
Hence, y is positive and we must choose the values of x for which the curve is above the x-axis. The final graph is shown below.
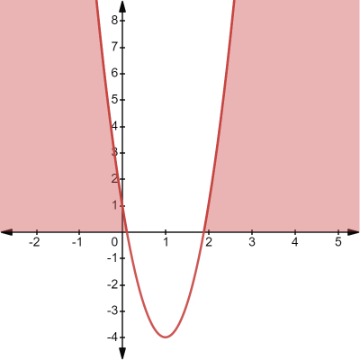
Example 4 (3), Aishah Amri - StudySmarter Originals
Real-World Examples Using Quadratic Inequalities
Quadratic inequalities may help model certain types of real-world scenarios such as finance, movement, and architecture. Here is an example that shows how we may apply quadratic inequalities in such cases.
The height of a ball tossed between two people can be modeled by the function
,
where the height h is given in meters and the time x is in seconds. At what time in its flight is the ball within 6 meters of the ground?
Solution
The height of the ball is described by the function h.
We want to find the values of x for which h(x) ≤ 6.
Graphing the function y = –7x2 + 15x – 4, we obtain the sketch below.
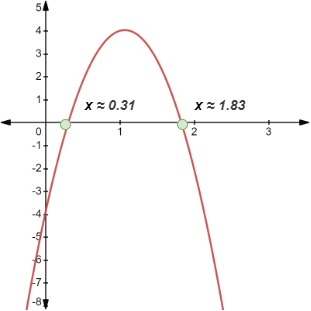
Example 5 (1), Aishah Amri - StudySmarter Originals
The roots can be found using the Quadratic Formula as the expression –7x2 + 15x – 4 cannot be factorized further using standard factoring methods. In doing so, we obtained the following two roots, correct to two decimal places: x ≈ 0.31 and x ≈ 1.83.
Now considering the inequality, the region for which the expression is satisfied is shown below.
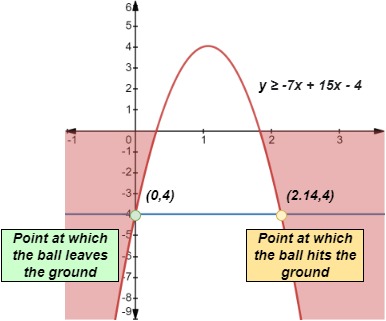
Example 5 (2), Aishah Amri - StudySmarter Originals
Notice that the graph lies below the x-axis when x < 0.31 or x > 1.83. From here, we conclude that the ball is within 6 meters of the ground for the first 0.31 seconds of its flight and again after 1.83 seconds until the ball hits the ground at 2.14 seconds.
Graph and Solve Quadratic Inequalities - Key takeaways
- The graph of a quadratic inequality is made up of all ordered pairs (x, y) that are solutions to the given quadratic inequality.
- Solving quadratic inequalities in one variable
- Write the quadratic inequality in general form: ax2 + bx + c, where a ≠ 0
- Completely factorize the quadratic expression of the inequality
- Identify the roots of the inequality
- Express the solution in inequality notation or interval notation
- Determine the behavior of the quadratic inequality
- For inequalities < or >, the parabola is a dashed line. This shows that the points on the parabola are not solutions.
- For inequalities ≤ or ≥, the parabola is solid. This shows that the points on the parabola are solutions.
- Graphing quadratic inequalities in two variables
- Sketch the quadratic function y = ax2 + bx + c. Determine the nature of the parabola based on the given inequality.
- Take a point (x1, y1) inside the parabola. Test to see if this point is a solution to the inequality.
- Shade the correct region that satisfies the inequality.
- For ax2+ bx + c < 0 identify the x-values for which the graph lies below the x-axis (since y is negative)
- The solution becomes x1 < x < x2
- For ax2+ bx + c > 0 identify the x-values for which the graph lies above the x-axis (since y is positive)
- The solution becomes x < x1 or x > x2


