What is a system of inequalities?
A system of inequalities is a set of inequalities that contain one or more than one variable.
Systems of inequalities are usually used to determine the best solution to a problem.
Let's say we were presented with a problem with the seating on a bus. The bus has a left seat (x) and a right seat (y) with a maximum seating capacity of 48 persons. This can be modeled mathematically as .
Now if we had more information that the bus is almost full and right seat of the bus can accommodate only 23 people. How many people are on the left side of the bus? This part can also be modeled mathematically as .
This is a typical system of inequality problem that can be solved using some of the ways to be described in the sections below.
How to solve systems of inequalities?
Solving systems of inequalities may differ slightly from systems of linear equations in the light that the substitution method and the elimination method cannot be used. This is solely by the restrictions of the inequality signs <, >, ≤, and ≥. However, solving inequalities requires that they be graphed to find solutions to them.
We will learn in this section how to solve systems of inequalities by graphing two or more linear inequalities simultaneously. The solution of systems of linear inequalities is the region where the graphs of all linear inequalities in the system intercept. This means that every pair of the form (x, y) is a solution to the system of inequalities if (x, y) verifies each of the inequalities. The intersection of the solution set of each inequality is denoted by ∩.
Steps to solve systems of inequalities
When you want to solve systems of inequalities, you will need to follow the following steps below.
Solving systems of inequalities in two variables
Below are examples to take you through solving systems of inequalities.
Solve the following systems of inequalities.
Solution
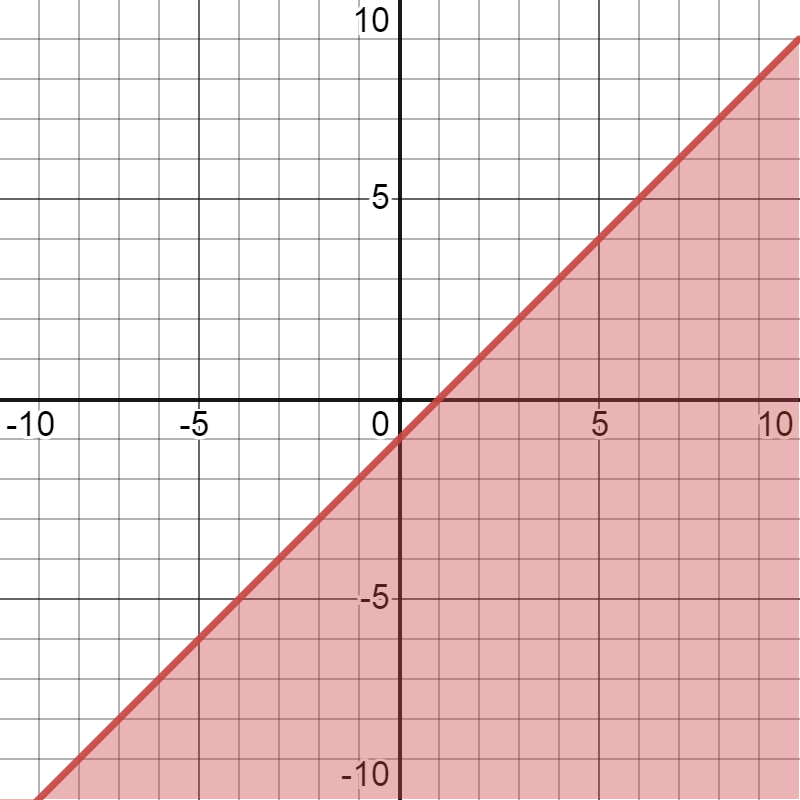
Since we already have the y variable isolated in both inequalities, we will go ahead and graph that immediately. Let us find the points we would have to graph them with. We will use the intercept method here. What will be the value of x when y = 0? What will be the value of y, when x = 0? We can replace the inequality sign with an equation sign so it gets easier to solve for now.
When ,
When ,
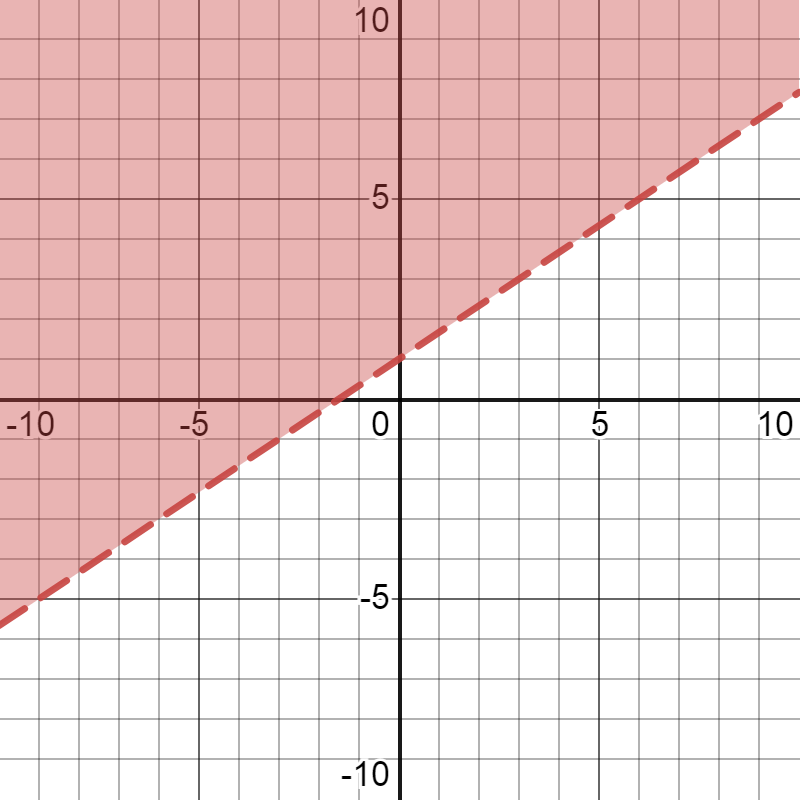
We now have coordinates for our first line. However, because the sign there is ≤, the line of the graph will be solid. We can also determine which side of the line will have to be shaded mathematically by substituting (0, 0) into the equation to see if it is true.
This means that the point (0, 0) is not less or equal to -1, therefore, we will shade the opposite side of the line where (0, 0) does not exist.
Region y = x – 1 - StudySmarter OriginalWe will graph the second inequality also by finding two points using the intercept method. What will be the value of x when y = 0? What will be the value of y, when x = 0? We can replace the inequality sign with an equation sign so it gets easier to solve for now.
When ,
When ,
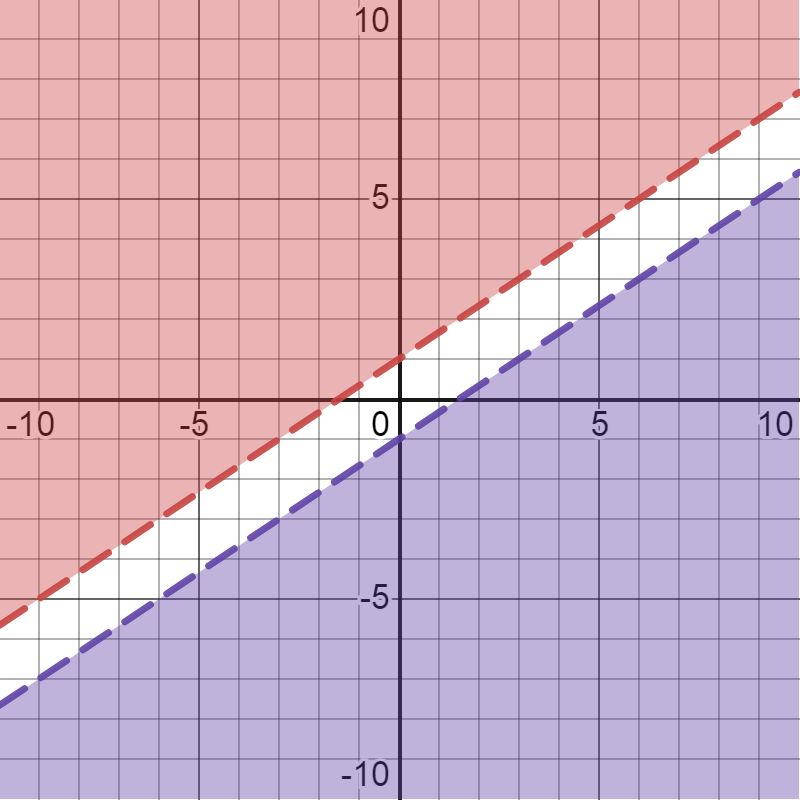
We now have coordinates for our second line. However, because the sign there is <, the line of the graph will be dotted. We will also determine which side of the line will have to be shaded mathematically by substituting (0, 0) into the equation to see if it is true.
This is actually true, therefore we will shade the part of the line that has the point (0, 0).
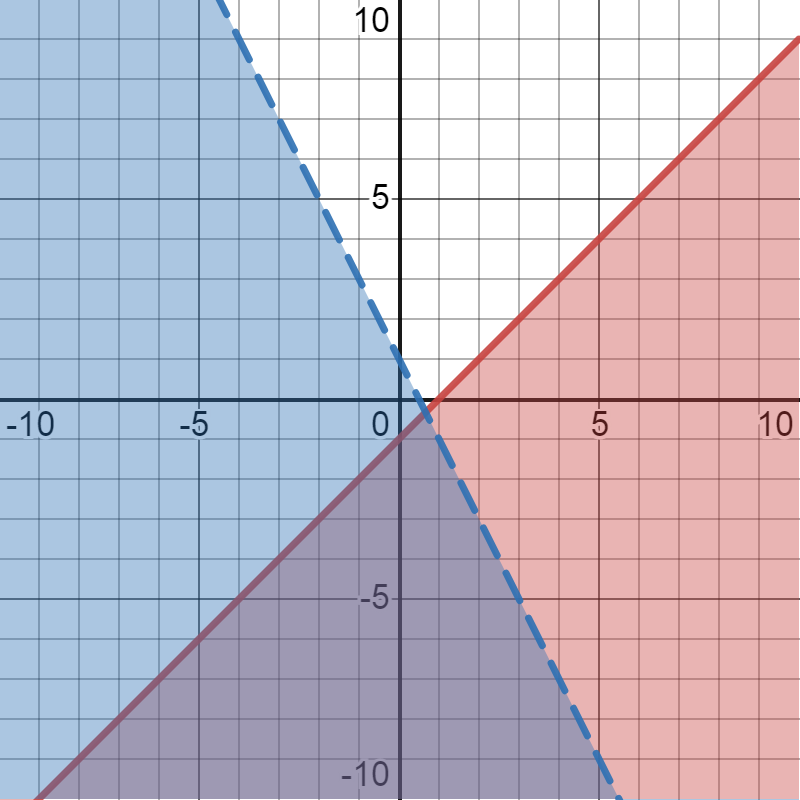
Graph of system y ≤ x – 1 and y < –2x + 1 - StudySmarter OriginalThe solution of the system is the intersection of the two shaded regions.
Solve the following system of inequalities.
Solution
We will graph the first inequality first. We will find the points by using the intercept method.
When ,
When ,
Since we have enough points to construct the line, we will plot our first inequality.
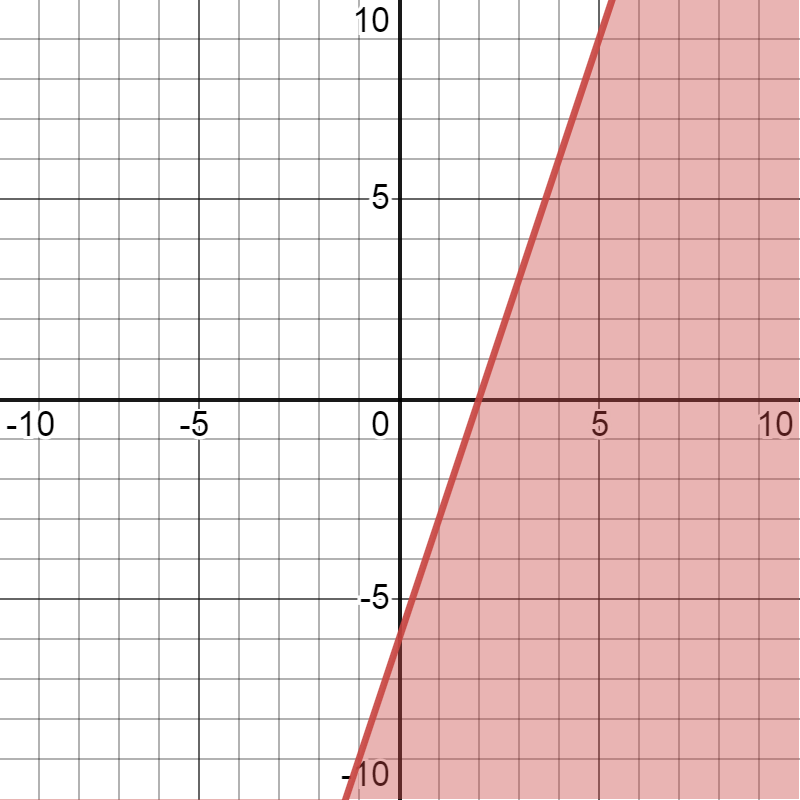
Region 6x – 2y ≥ 12 - StudySmarter OriginalWe will graph the second inequality also by finding two points using the intercept method.
When ,
When ,
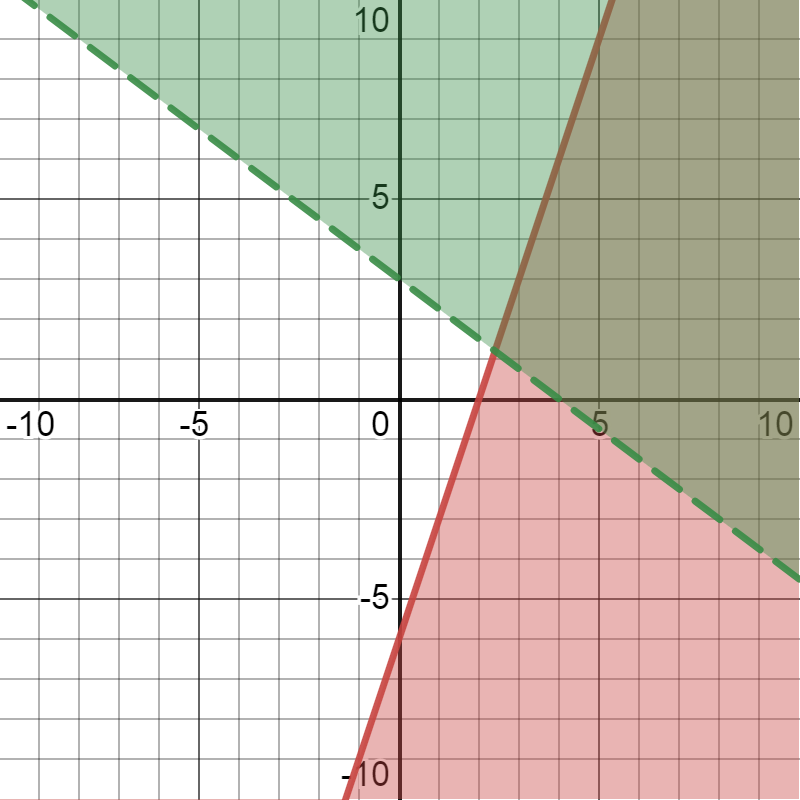
Graph of system 6x – 2y ≥ 12 and 3x + 4y > 12 - StudySmarter OriginalThe solution of the system is the intersection of the two shaded regions.
Solve the following system of inequalities.
Solution
Let us first graph the first inequality by using the intercept method.
When ,
When ,
Since we have enough points to construct the line, we will plot our first inequality.
Region –4x + 6y > 6 - StudySmarter OriginalWe will graph the second inequality also by finding two points using the intercept method.
When ,
When ,
Graph of system –4x + 6y > 6 and 2x – 3y > 3 - StudySmarter OriginalWe notice here that both lines are parallel, hence, there is no region that intersects. These are called systems with no solutions.
Solving systems of inequalities in one variable
Systems of inequalities in one variable involve finding the range within which the solution satisfies the inequality. However, it is important to state again that we are going to be dealing with two simultaneous inequalities, as that is what systems are. These two equations are solved differently and put together to have a final solution. Let us take examples of how this is done.
Solve the inequality below and represent it on a number line.
Solution
As mentioned earlier, we will solve each inequality separately. So we will take the first inequality here.
We will now solve this algebraically, in an attempt to isolate the x variable. By that, we will subtract 3 from each side of the inequality.
Divide both sides of the inequality by 2 to isolate the x.
The interval notation will be written as
We now have a solution for the first inequality. Let's do the same process for the second.
We will also want to isolate the x variable in this inequality too. We will subtract 2 from each side of the inequality.
We can now simply multiply each side of the inequality by –1. However, a rule on dealing with inequalities says that the sign changes to be the opposite once both sides are multiplied by a negative number. Hence, ≥ will become ≤.
Notice that the sign changes above?
The interval notation will be written as
The intersection of these solution sets is the set;
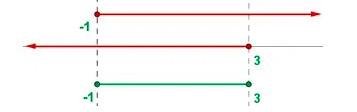
Number line of the intersection set [-1, 3], superprof.co.ukSolve the inequality below and write the interval notation of it.
Solution
We will solve both inequalities separately. We will do the first one first.
We will attempt to isolate the y by first subtracting 3 from each side of the inequality.
We will divide each side of the inequality by 2.
The solution set in interval notation is .
We will now solve the second inequality.
We will isolate x by subtracting 6 from each side of the equation
We will multiply each side of the inequality by –1. The sign changes to be the opposite once both sides are multiplied by a negative number. Hence, < will become >.
The solution set in interval notation is .
Solving Systems of Inequalities - Key takeaways
- A system of inequalities is a set of two or more inequalities in one or more variables.
- Systems of inequalities are used when a problem requires a range of solutions, and there is more than one constraint on those solutions.
- The region of intersection of two inequality is the solution to it.
- When systems of inequalities do not have solutions, their lines do not intercept on the coordinate plane.


